875
Christmas Challenge Report
Christmas Challenge Report
More Report pages
Report Author: Steven Stanford
875
Share template with others
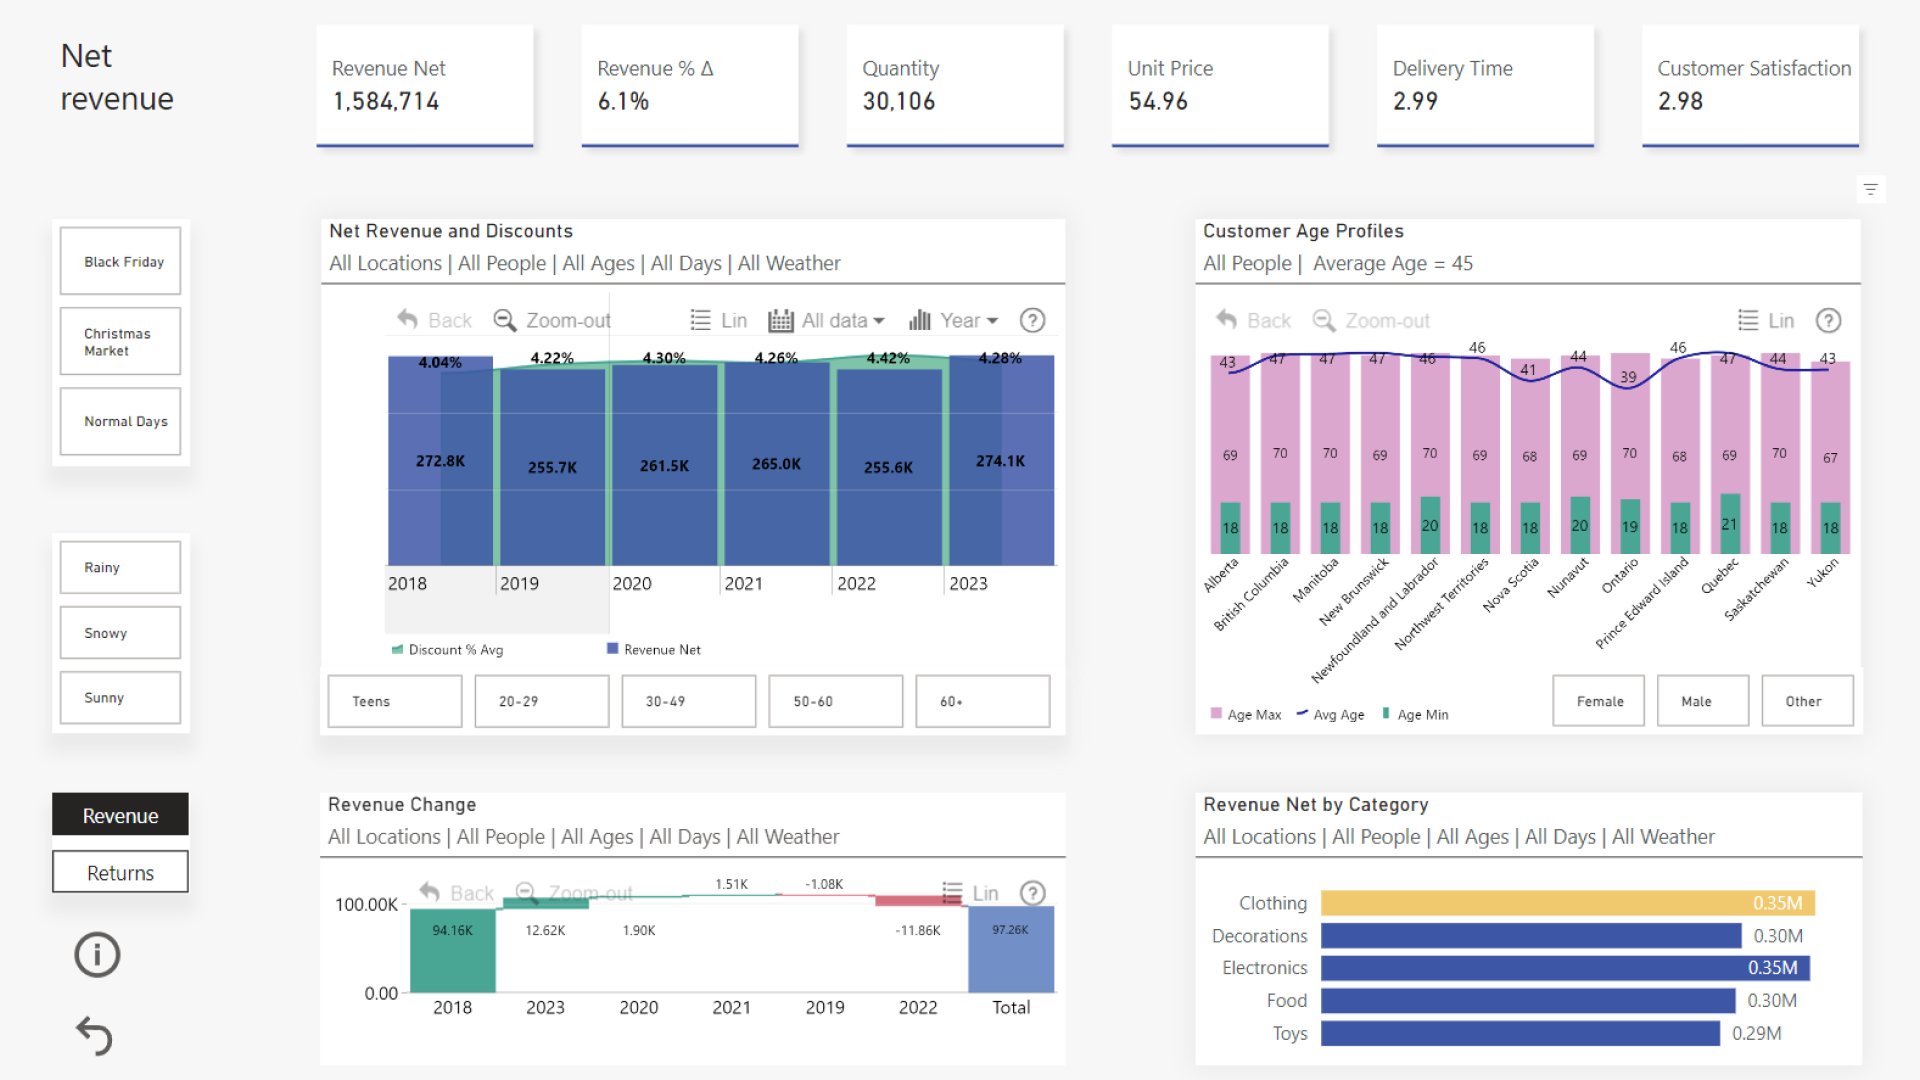
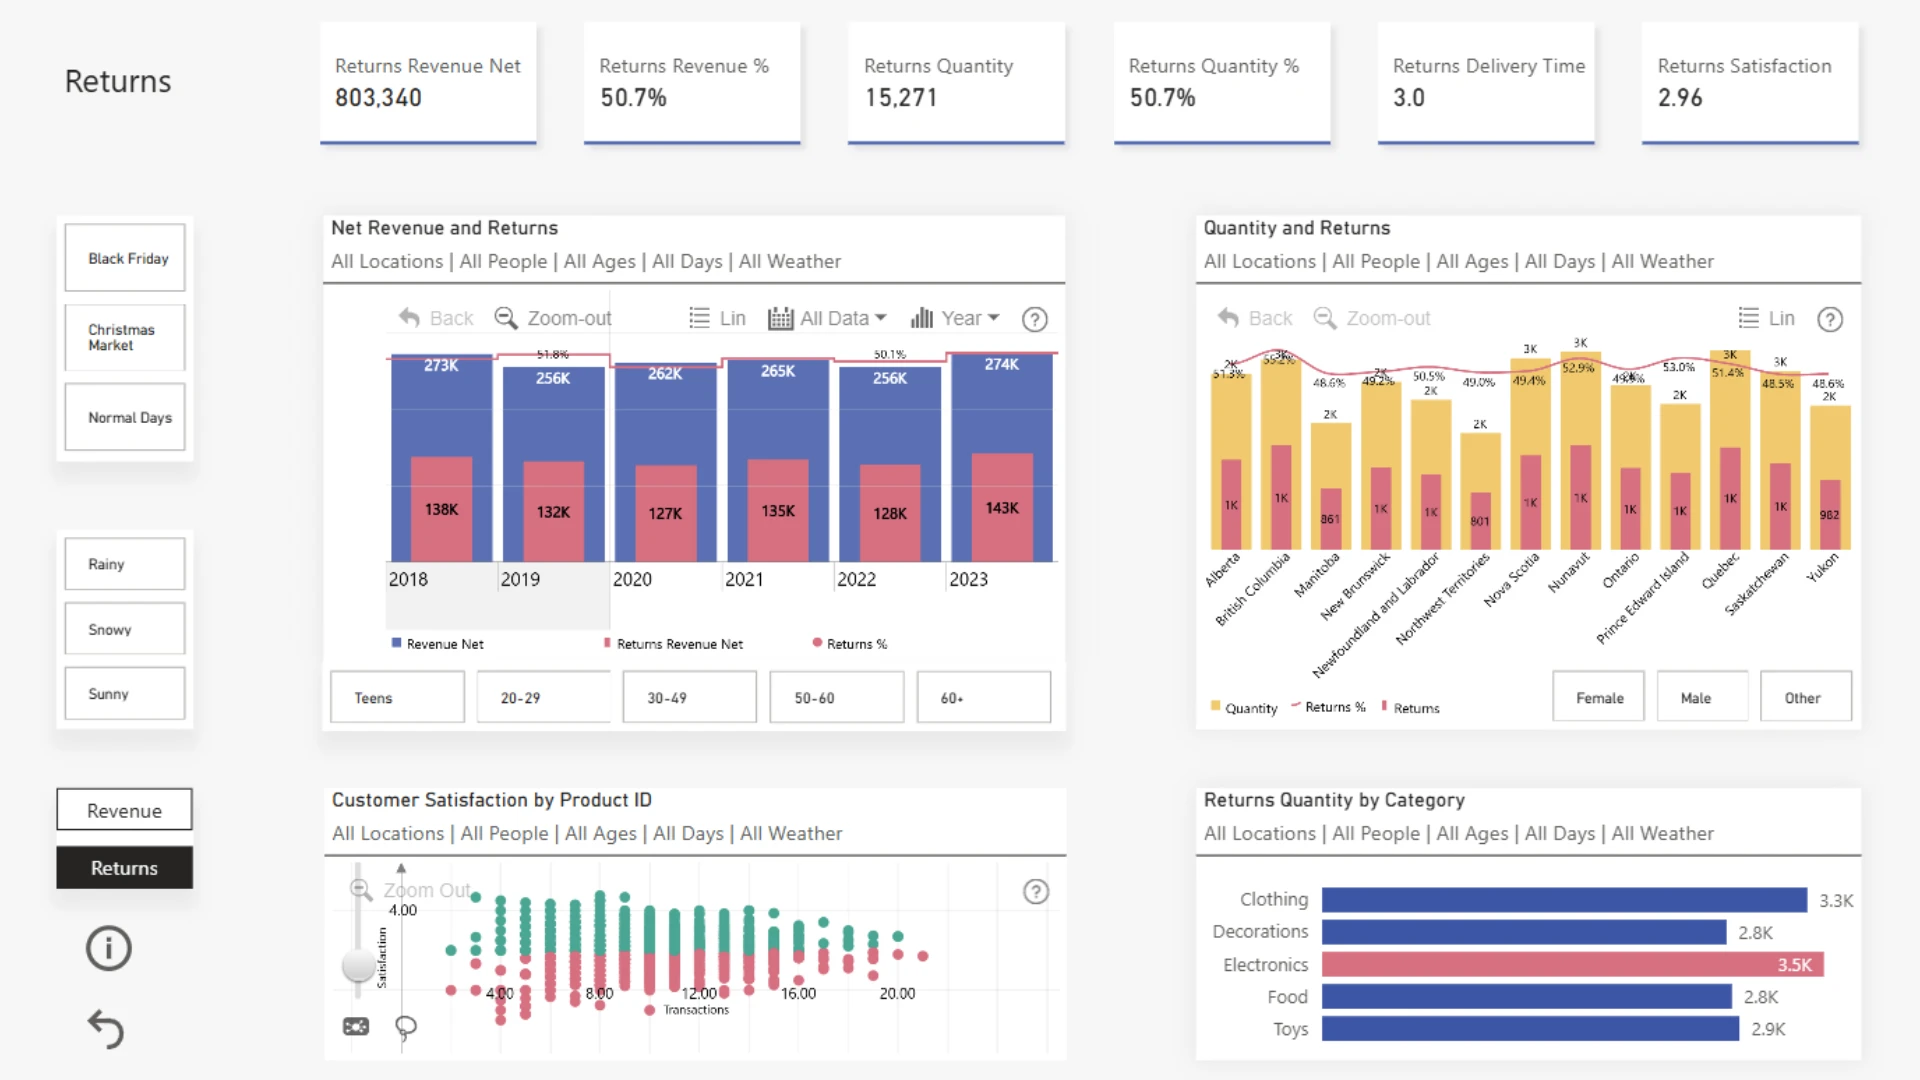
Report submitted for the FP20 Analytics ZoomCharts Challenge, December 2024. The report was built using the Christmas Sales & Trends Dataset and includes ZoomCharts custom Drill Down PRO visuals for Power BI.
Author's description:
This was a bit rushed, as I’ll soon be on a Pacific island without internet, soaking up the sun. The report focuses on net revenue and returns, with all visuals acting as filters, supported by four standard filter visuals on each page.
The opening graphic, which displays revenue and discounts, becomes particularly revealing when months are selected. Purchasing patterns vary across age groups, influenced by the time of year and discounts offered. Is it any surprise that teenagers respond most to the highest discounts?
The preferred product type purchases might be skewed due to how I created the customer table. Initially, I planned to have each transaction represented as a customer. However, to reduce the customer table size, I removed duplicates. This process ended up selecting the top customer ID and its associated demographics.
Hope you enjoy the report. Merry Christmas!
Steven
ZoomCharts visuals used




4U Report Challenges
Participate in data challenges, build and submit reports to get free template downloads.
Join CommunityMobile view allows you to interact with the report. To Download the template please switch to desktop view.



How to use a PBIX template
Preview the interactive report, download the PBIX file, open it in Power BI Desktop, and replace the same data connection with your own dataset.
Preview and download
Explore the report online and download the PBIX template file.
Open in Power BI Desktop
Open the downloaded PBIX file in Power BI Desktop.
Connect your data
Replace the sample data source with your own dataset.
Refresh and adjust
Refresh the model and update fields or visual were needed.
Save and share
Save your report and publish it for your audience.


