1384
CANDY MARKET SHARE ANALYSIS
CANDY MARKET SHARE ANALYSIS
Report Author: Agbata Dickson Ukolojo
1384
Share template with others
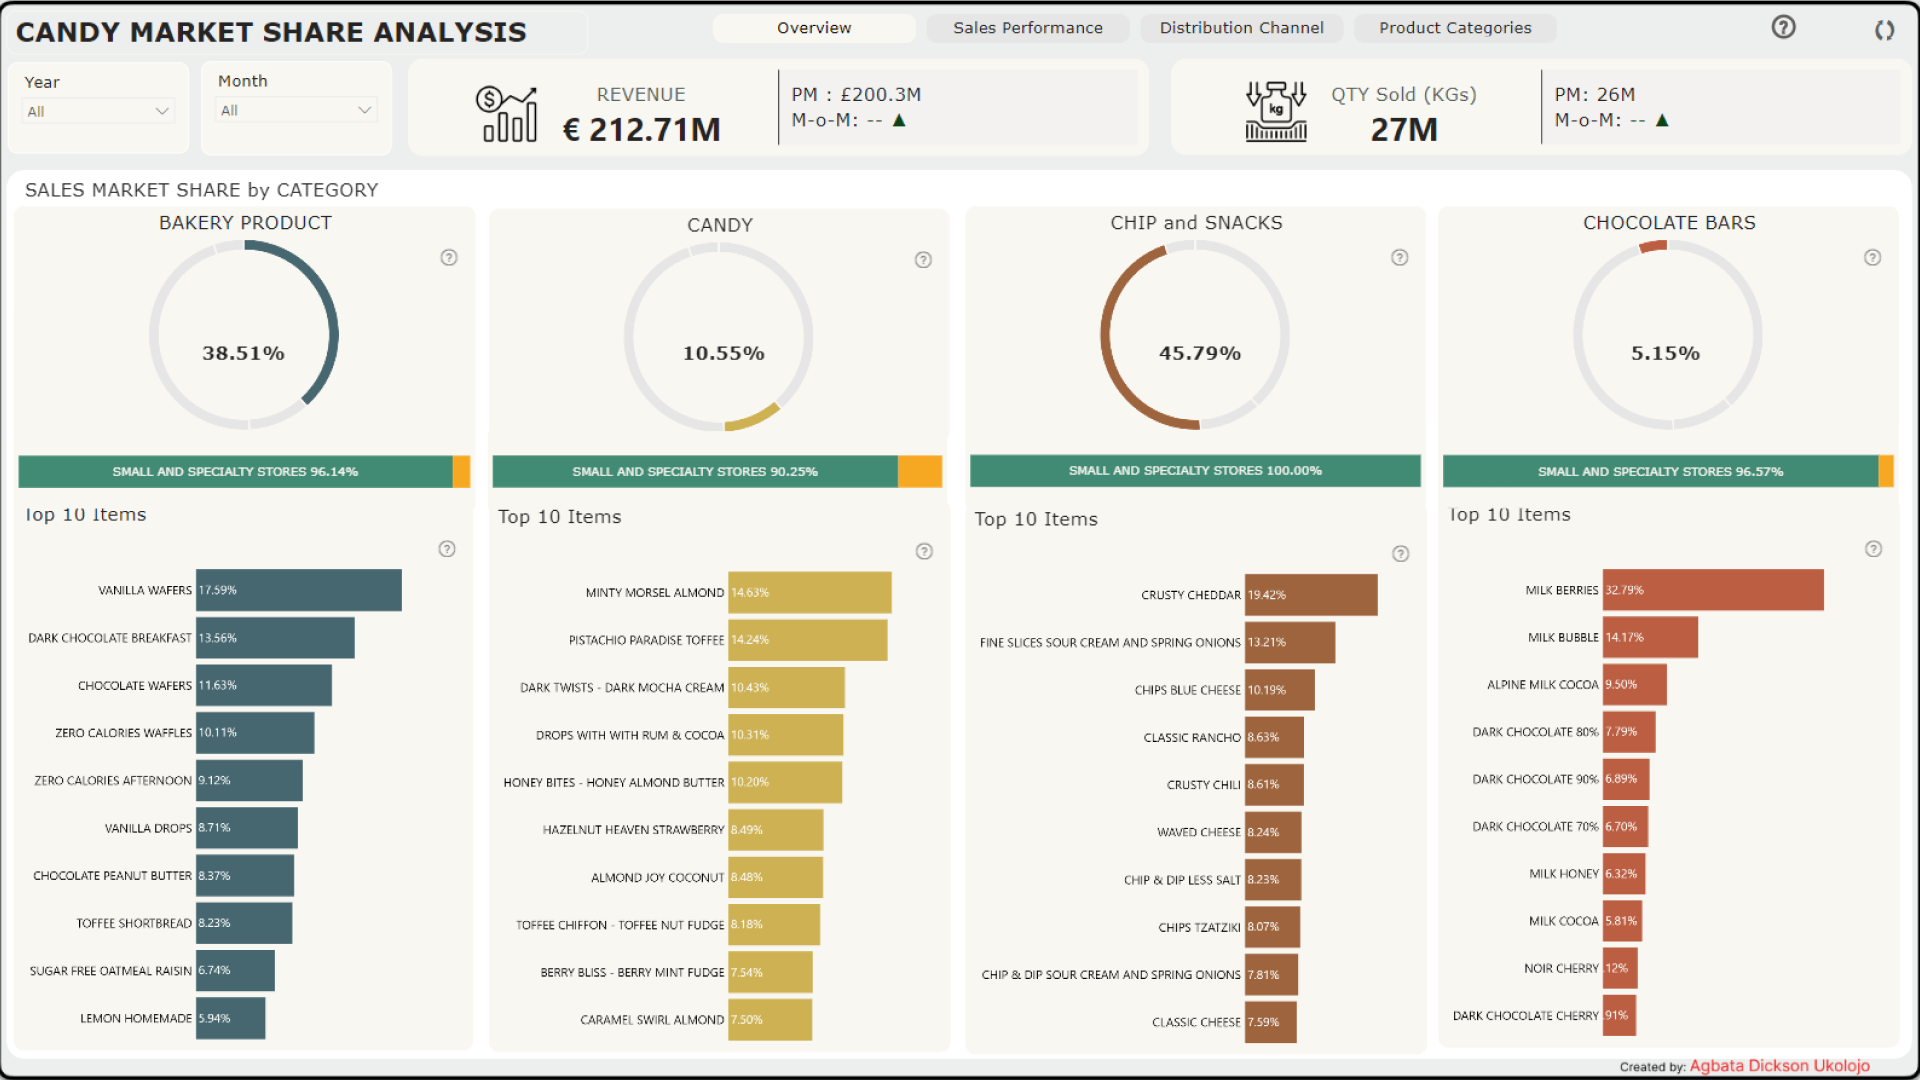
Report submitted for the FP20 Analytics ZoomCharts Challenge, November 2024. The report was built using the Candy Market Share dataset and includes ZoomCharts custom Drill Down PRO visuals for Power BI.
Author's description:
This report delivers a comprehensive analysis of revenue share and quantity sold (in KGs) across various dimensions, including product category, product type, brand, and individual items. Key insights focus on: Revenue Trends: Monthly trends for 2023, including Month-over-Month (MoM) sales performance. Analysis of seasonal effects influencing product sales, with a specific emphasis on the impact of seasons on candy sales. Manufacturer and Channel Insights: Revenue share distribution across manufacturers. Identification of the most profitable distribution channels. Analysis of the preferred packaging types used for the products. Key Features of the Report: Color-coded visualizations for clarity and quick interpretation. Inclusion of Key Performance Indicators (KPIs) to track performance metrics effectively. A four-page summary consolidated into a single-page view for streamlined reporting. Interactive Help and Reset buttons for enhanced usability. This report provides actionable insights to drive strategic decision-making and optimize performance across product and distribution dimensions.


4U Report Challenges
Participate in data challenges, build and submit reports to get free template downloads.
Join CommunityMobile view allows you to interact with the report. To Download the template please switch to desktop view.
How to use a PBIX template
Preview the interactive report, download the PBIX file, open it in Power BI Desktop, and replace the same data connection with your own dataset.
Preview and download
Explore the report online and download the PBIX template file.
Open in Power BI Desktop
Open the downloaded PBIX file in Power BI Desktop.
Connect your data
Replace the sample data source with your own dataset.
Refresh and adjust
Refresh the model and update fields or visual were needed.
Save and share
Save your report and publish it for your audience.


