1180
Business Financial Analysis
Business Financial Analysis
Report Author: Ngoc Duong
1180
Share template with others
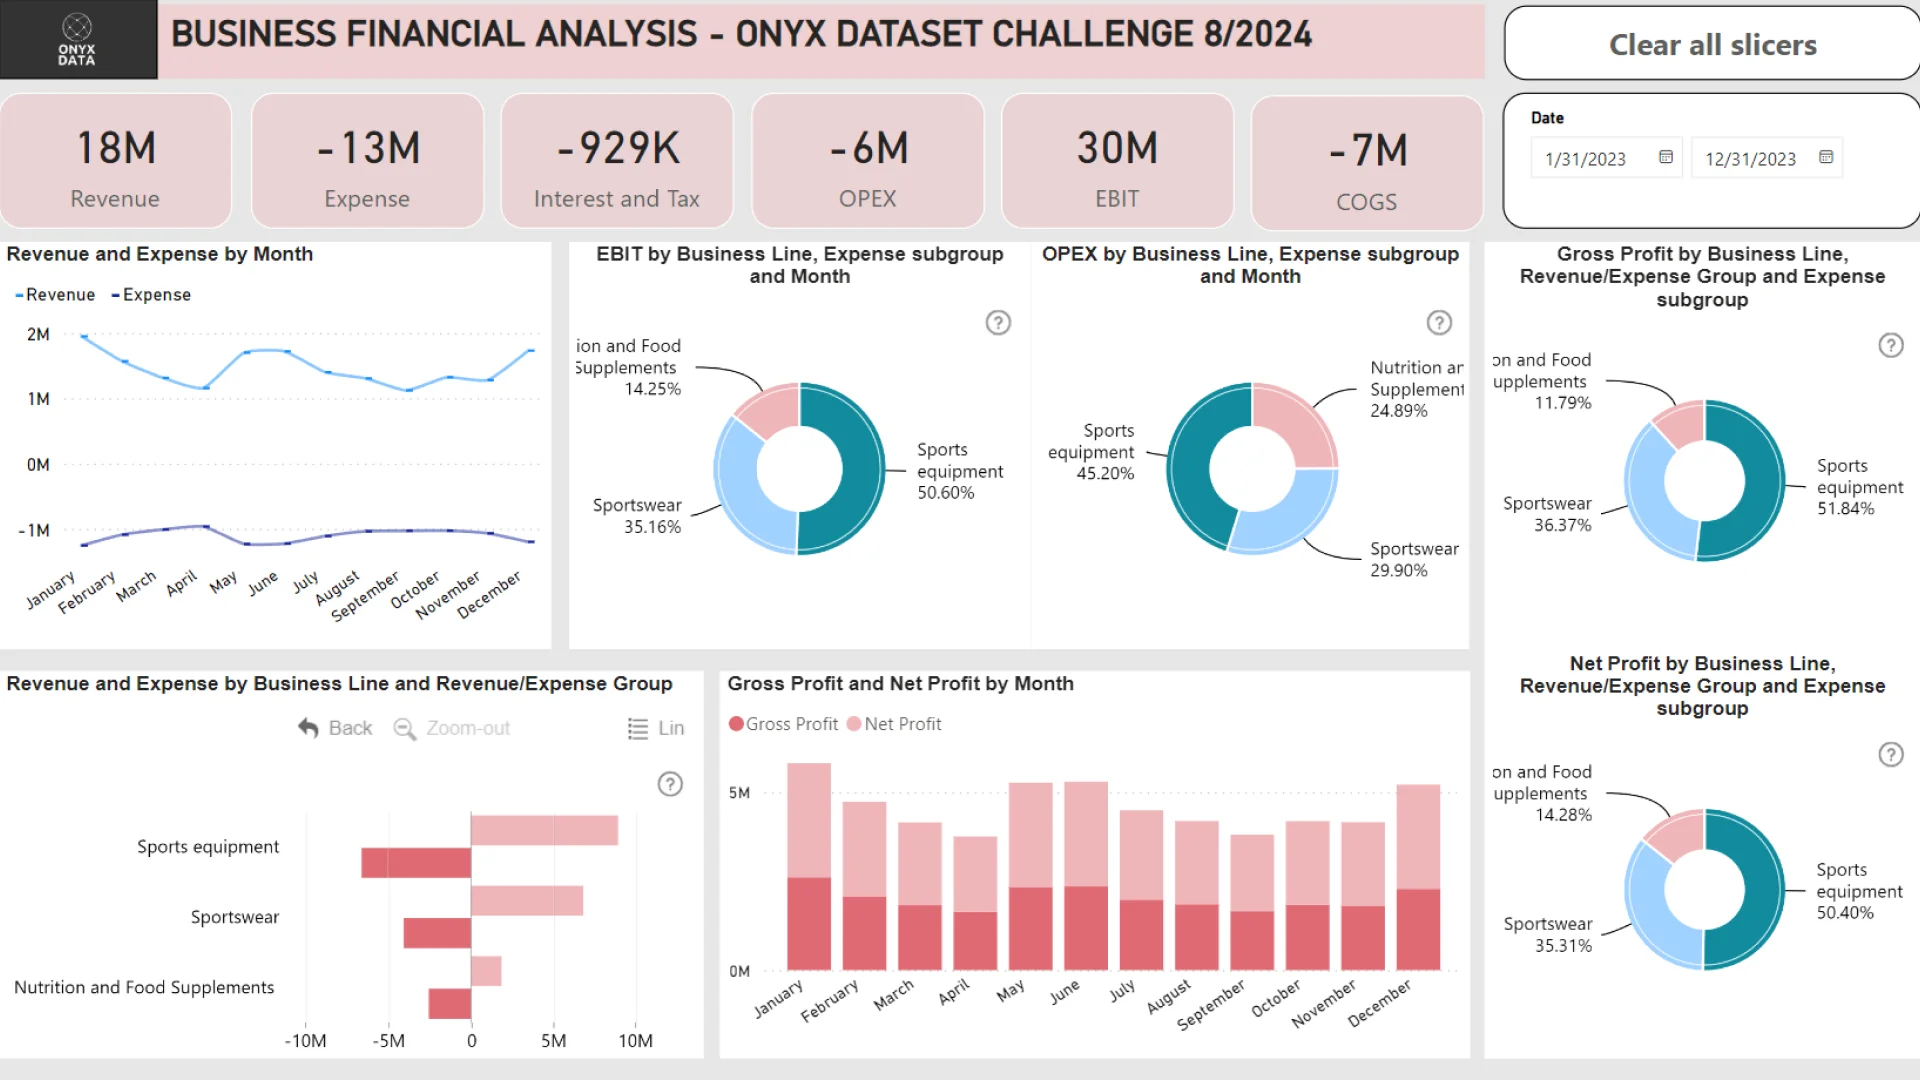
Report submitted for Onyx Data DataDNA ZoomCharts Mini Challenge, August 2024. The report was built based on Fitness Company Finance Dataset and includes ZoomCharts custom Drill Down PRO visuals for Power BI.
Author's description:
This challenge involves analyzing the financial performance of a sporting goods manufacturer with three business lines: Sports Inventory, Sportswear, and Nutrition & Food Supplements. Participants calculate metrics such as revenue, expenses, COGS, EBIT, OPEX, interest and tax, gross profit, and net profit. These indicators are then presented on a dashboard, categorized by business line, expense subgroup, revenue/expense group, and month.
4U Report Challenges
Participate in data challenges, build and submit reports to get free template downloads.
Join CommunityMobile view allows you to interact with the report. To Download the template please switch to desktop view.
Was this helpful? Thank you for your feedback!
Sorry about that.
How can we improve it?