906
Benjamin Kihuria CRM Analysis Report
Benjamin Kihuria CRM Analysis Report
More Report pages
Report Author: Benjamin Kihuria
906
Share template with others
Report submitted for FP20 Analytics ZoomCharts Challenge 17 (July 2024). The report was built with the CRM & Sales Pipeline Analysis dataset and includes ZoomCharts custom Drill Down PRO visuals for Power BI.
Author's description:
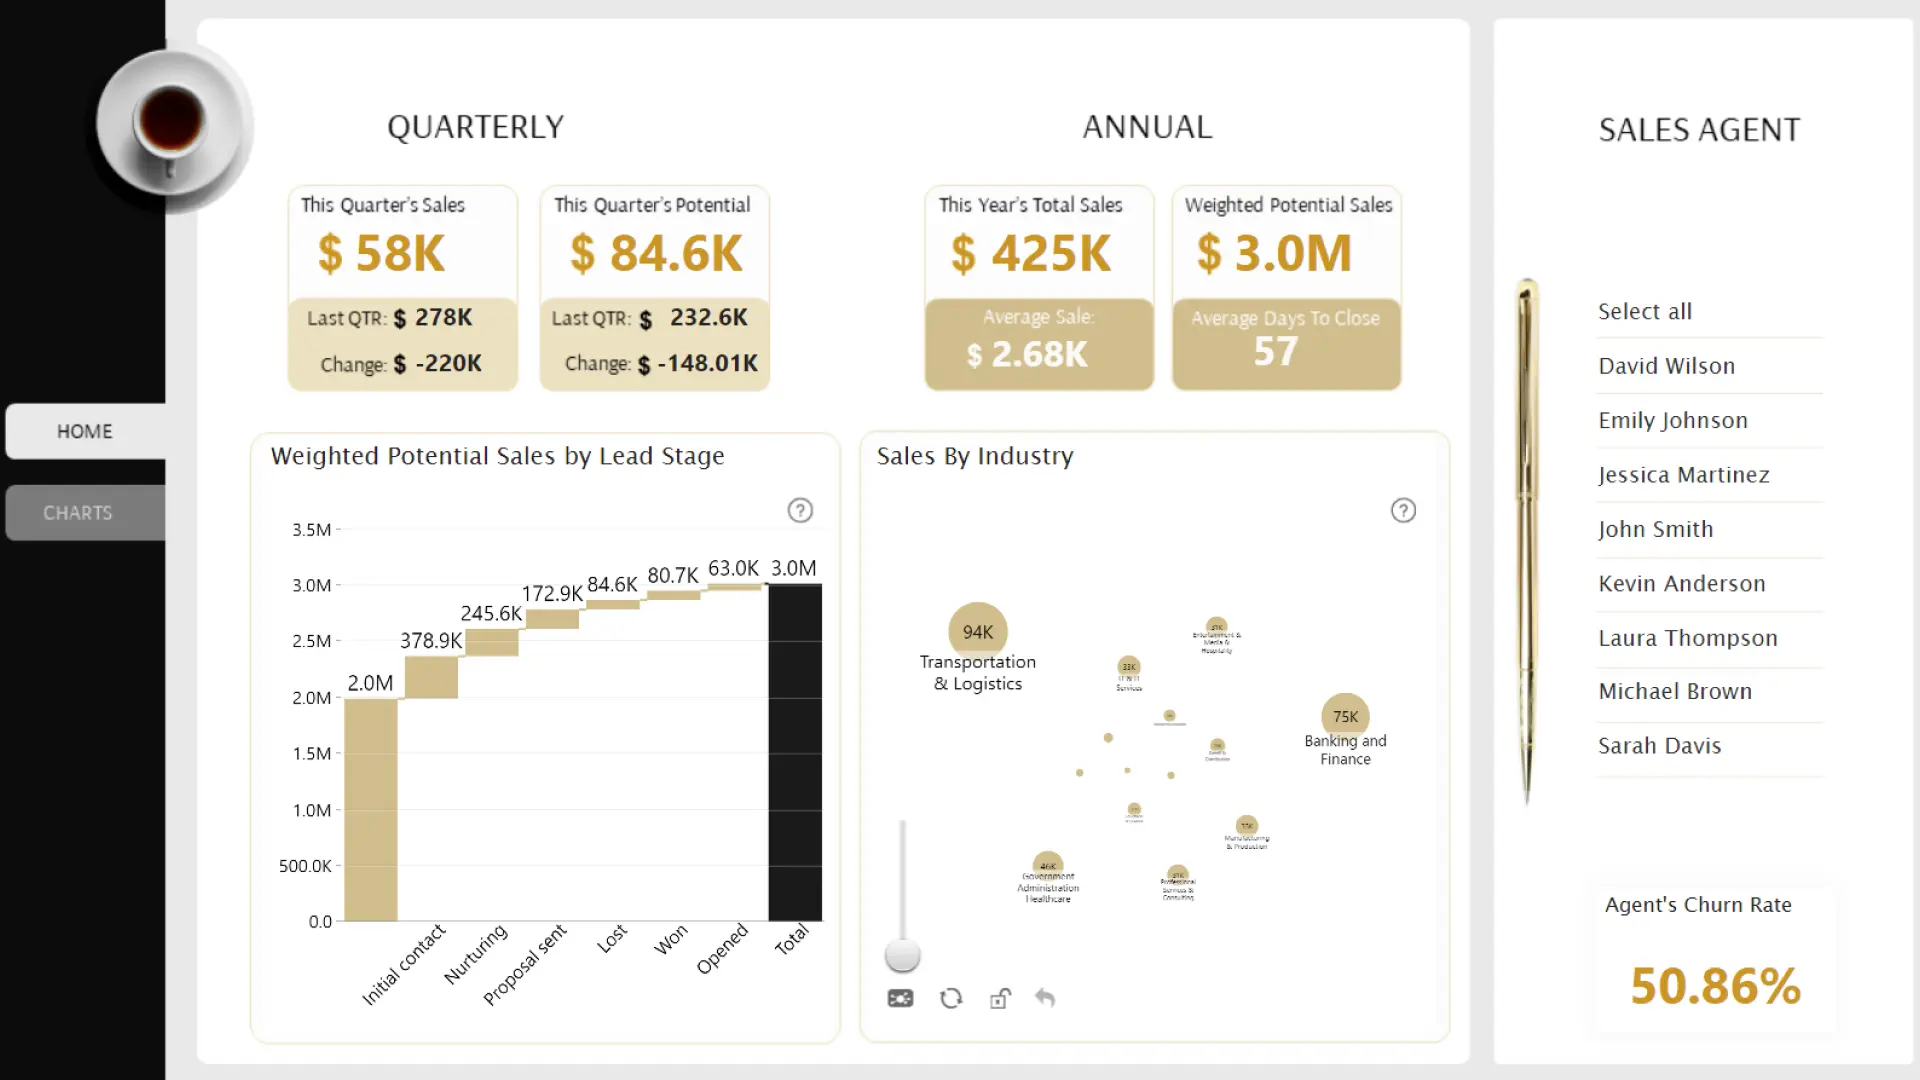
A question that is commonly asked by the team lead of a sales team is, who's making money, and who is losing us money. In this dataset, we can answer the questions in various forms: Who is making us money? By - highest total sales and weighted sales projections so far in the year? Laura By - who has lost us the least amount of customers (lowest churn rate)? Sarah By - who has the shortest sales close time? David Who is losing us money? By - who hasn't made a sale this quarter? David By - who has the highest customer churn rate and takes longest to close a deal? Jessica


4U Report Challenges
Participate in data challenges, build and submit reports to get free template downloads.
Join CommunityMobile view allows you to interact with the report. To Download the template please switch to desktop view.



How to use a PBIX template
Preview the interactive report, download the PBIX file, open it in Power BI Desktop, and replace the same data connection with your own dataset.
Preview and download
Explore the report online and download the PBIX template file.
Open in Power BI Desktop
Open the downloaded PBIX file in Power BI Desktop.
Connect your data
Replace the sample data source with your own dataset.
Refresh and adjust
Refresh the model and update fields or visual were needed.
Save and share
Save your report and publish it for your audience.


