B2B Sales Pipeline Analytics Power BI Report
Gain complete visibility into your sales pipeline with this interactive B2B Sales Pipeline Analytics Power BI Report, designed for organizations that manage complex sales cycles, multiple markets, and large volumes of opportunities. Built using realistic B2B SaaS and professional services sales data, this report helps sales leaders, account managers, and revenue operations teams monitor pipeline health, track deal progression, and uncover opportunities to improve conversion rates and revenue performance.
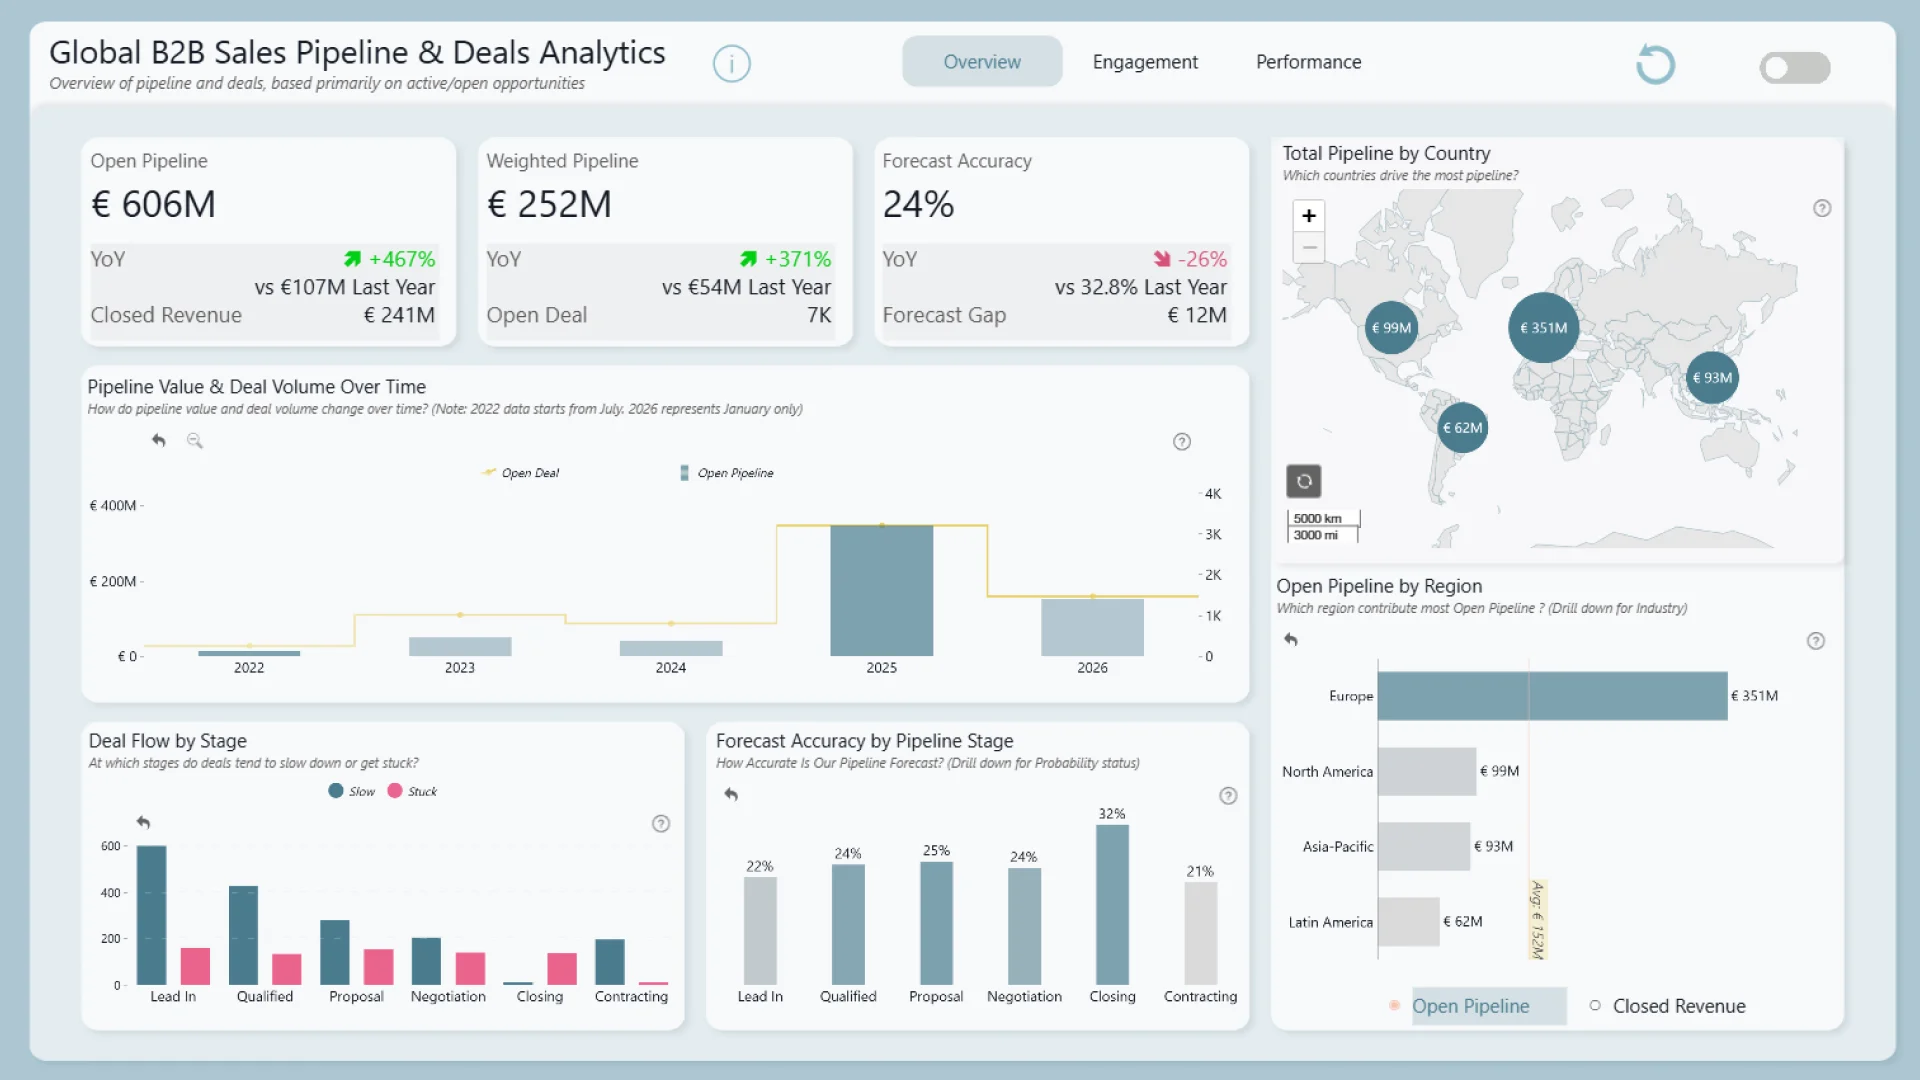
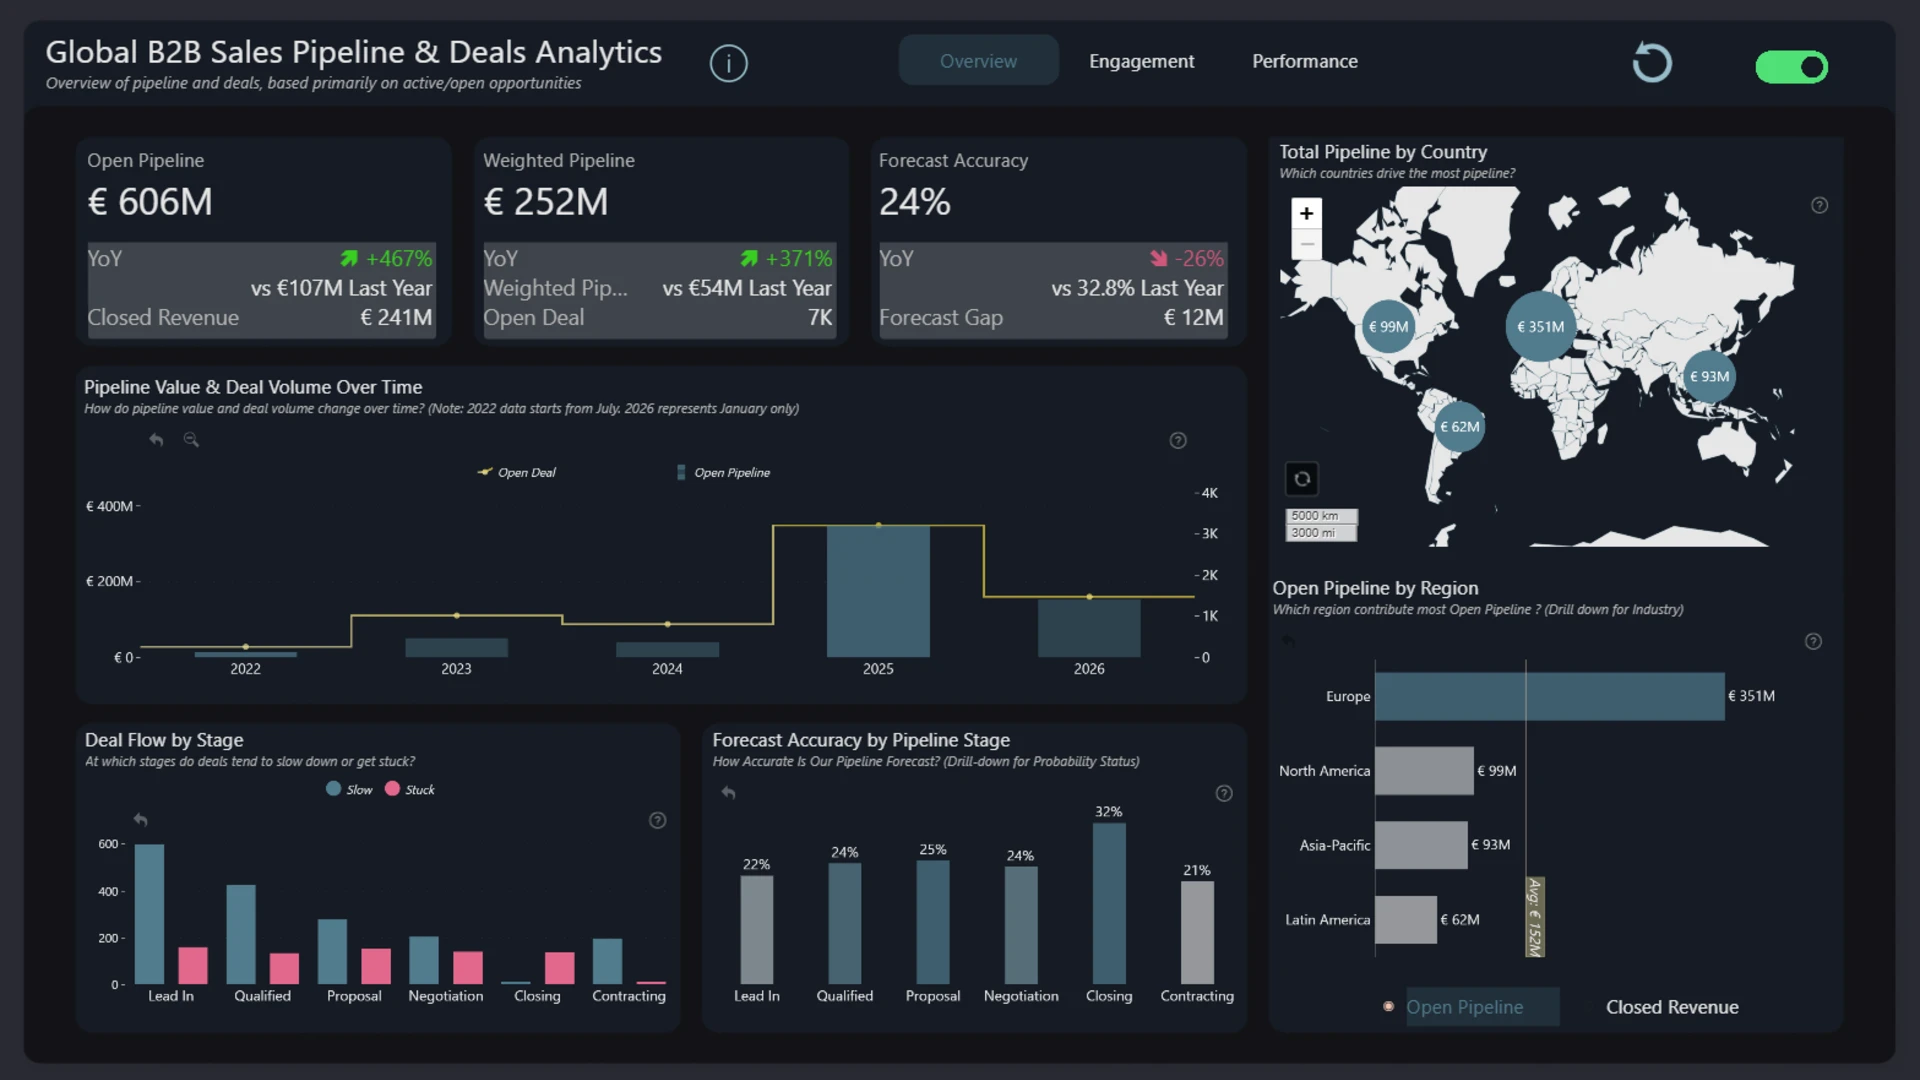
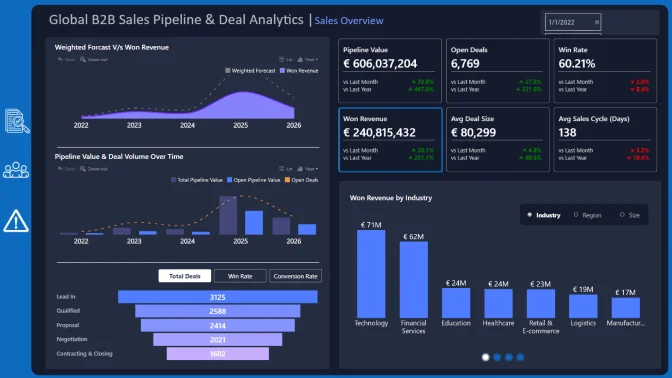
The report provides a comprehensive overview of active deals, pipeline value, sales activities, and customer engagement across different regions, industries, and sales stages. Interactive visualizations powered by ZoomCharts Drill Down PRO enable users to move seamlessly from high-level pipeline summaries to detailed deal analysis, making it easy to identify bottlenecks, stalled opportunities, and high-priority accounts.
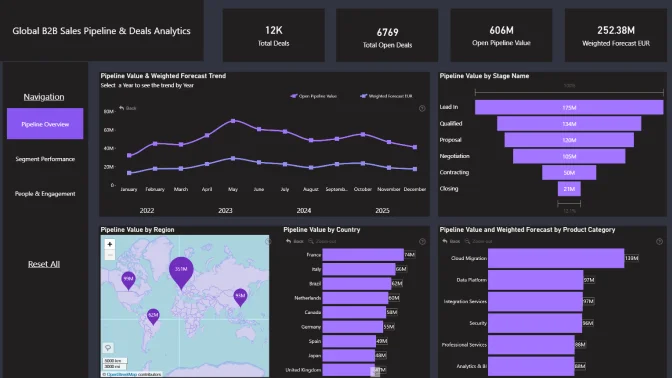
Users can explore how opportunities progress through the sales funnel, compare pipeline performance across geographic markets, and analyze the distribution of deals by industry, company size, and sales stage. Dynamic filtering and drill-down capabilities allow teams to focus on specific segments, helping them understand which opportunities contribute most to pipeline value and where additional attention is needed.
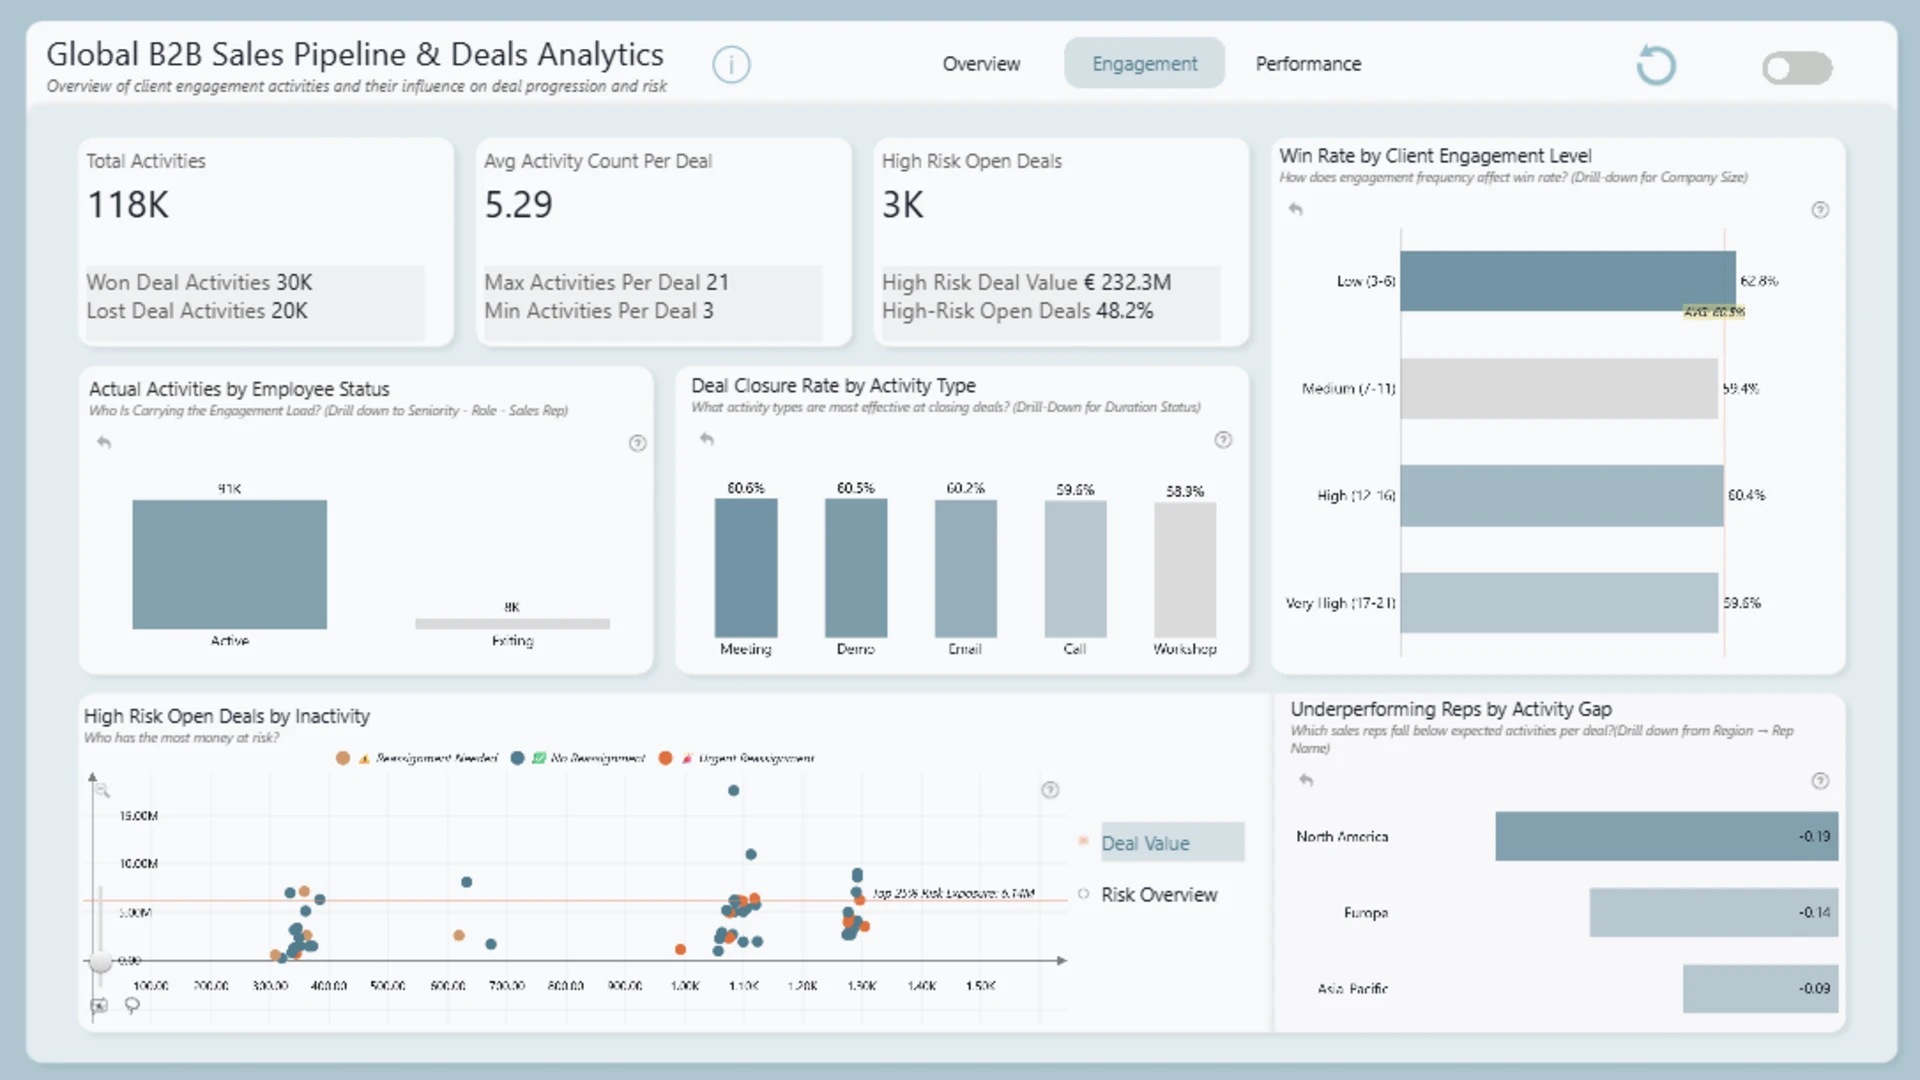
The report also highlights sales activities and customer interactions, providing valuable context for understanding deal momentum and engagement levels. By connecting pipeline metrics with activity data, sales teams can evaluate whether opportunities receive sufficient follow-up and identify accounts that may require immediate action to prevent delays or lost revenue.
Key Insights Included
- Total pipeline value and opportunity volume
- Sales funnel and deal stage analysis
- Pipeline distribution by region and market
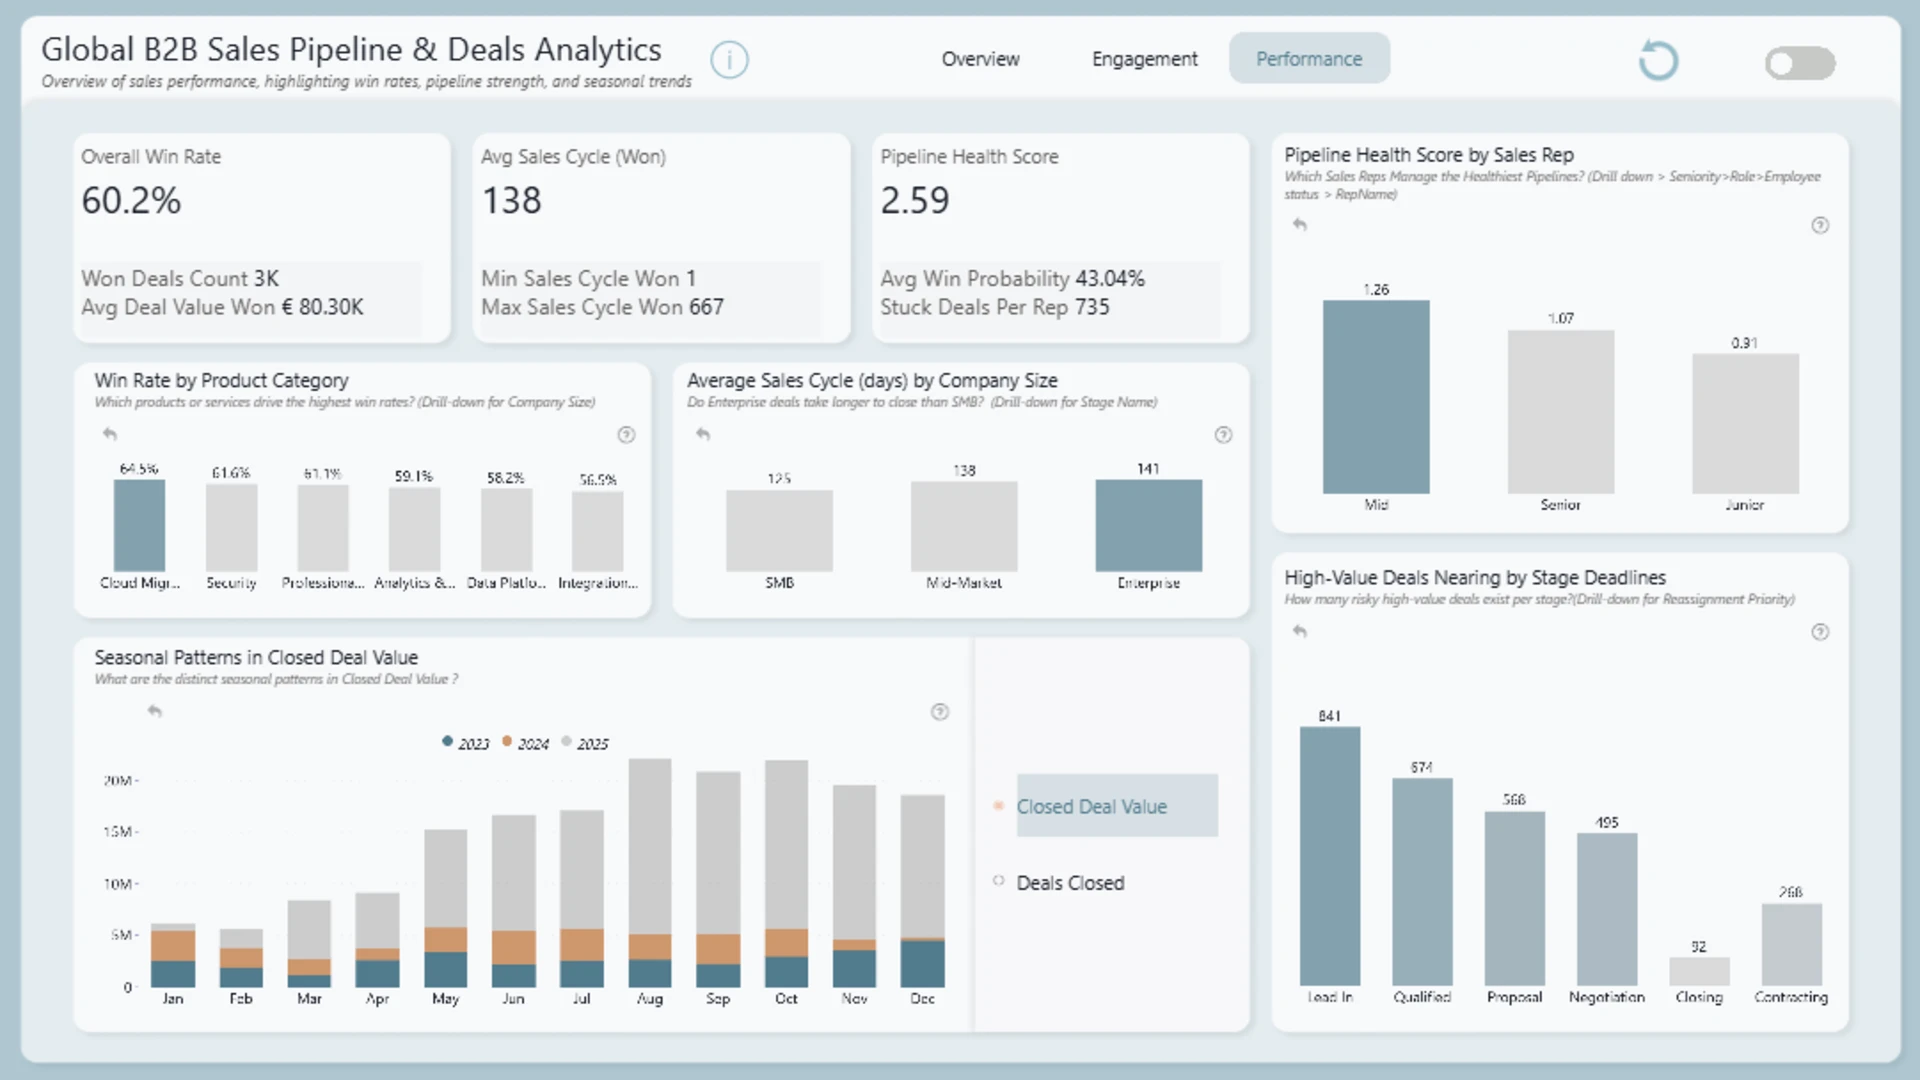
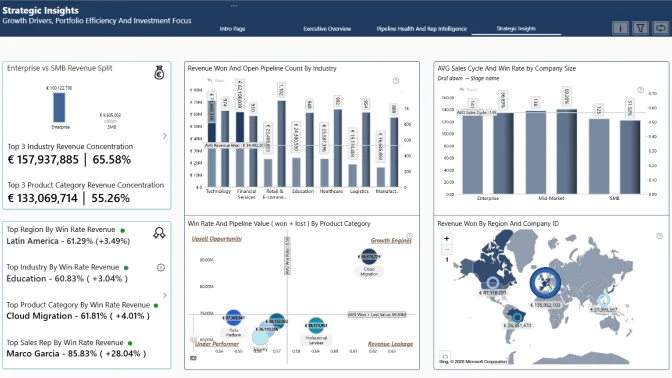
- Industry and customer segment performance
- Opportunity progression tracking
- Sales activity and engagement monitoring
- Identification of stalled and at-risk deals
- Interactive filtering and drill-down exploration
Business Benefits
- Improve visibility into sales pipeline performance
- Identify bottlenecks that slow deal progression
- Prioritize high-value opportunities effectively
- Monitor sales activity and customer engagement
- Support data-driven revenue planning and forecasting
- Optimize sales processes across regions and teams
This report demonstrates how Power BI and ZoomCharts custom visuals can transform sales data into actionable insights, enabling organizations to manage their pipelines more effectively, improve sales execution, and drive sustainable revenue growth. Whether you're analyzing regional performance, monitoring deal progression, or evaluating pipeline health, this report provides the tools needed to make faster and more informed business decisions.