696
B2B Sales Pipeline Power BI Report 9
B2B Sales Pipeline Power BI Report 9
Report Author: Akindele Omolayo
696
Share template with others
This interactive Power BI report explores the Global B2B Sales Pipeline & Deals Analytics dataset using ZoomCharts Drill Down PRO custom visuals for Power BI. It highlights pipeline value, deal progression, sales activity, and client engagement across regions and industries, helping teams monitor pipeline health and identify stalled or high-risk deals.
The report was submitted to the FP20 Analytics ZoomCharts Data Challenge #35 (February – March 2026).
Author’s Description:
This dashboard provides a comprehensive analysis of a B2B sales pipeline, focusing on pipeline growth, execution risk, and sales team performance.
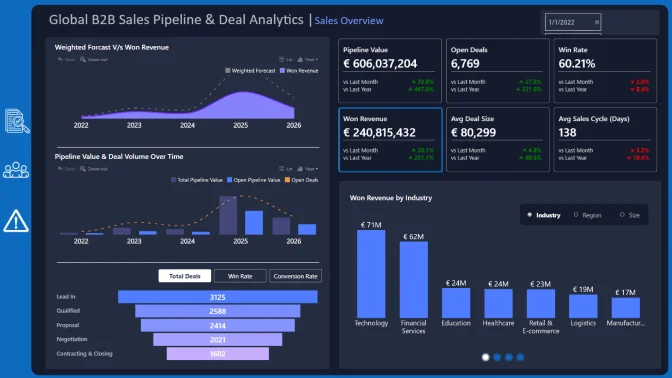
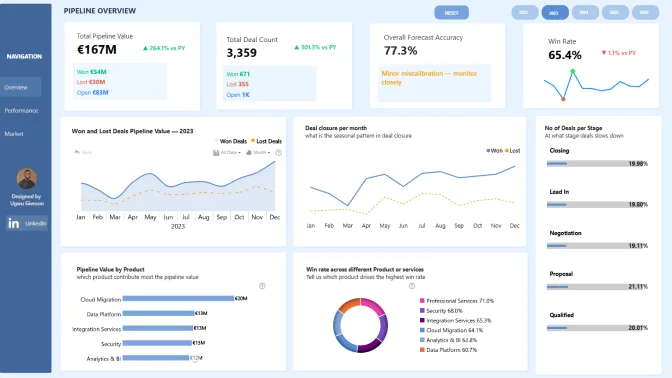
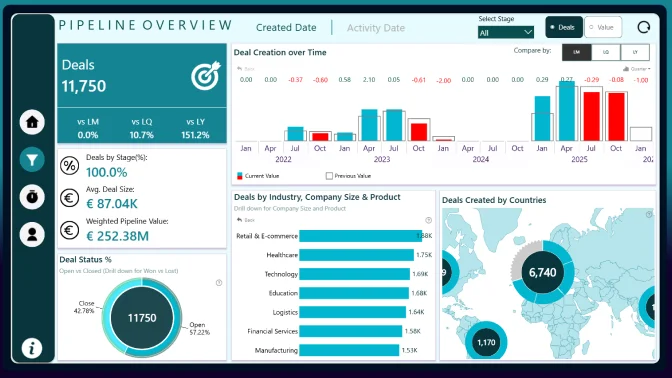
Page 1 – Pipeline Overview presents high-level KPIs, including total pipeline value, weighted pipeline, closed revenue, win rate, and pipeline velocity. The page highlights pipeline trends over time, stage distribution, industry performance, and regional forecast confidence.
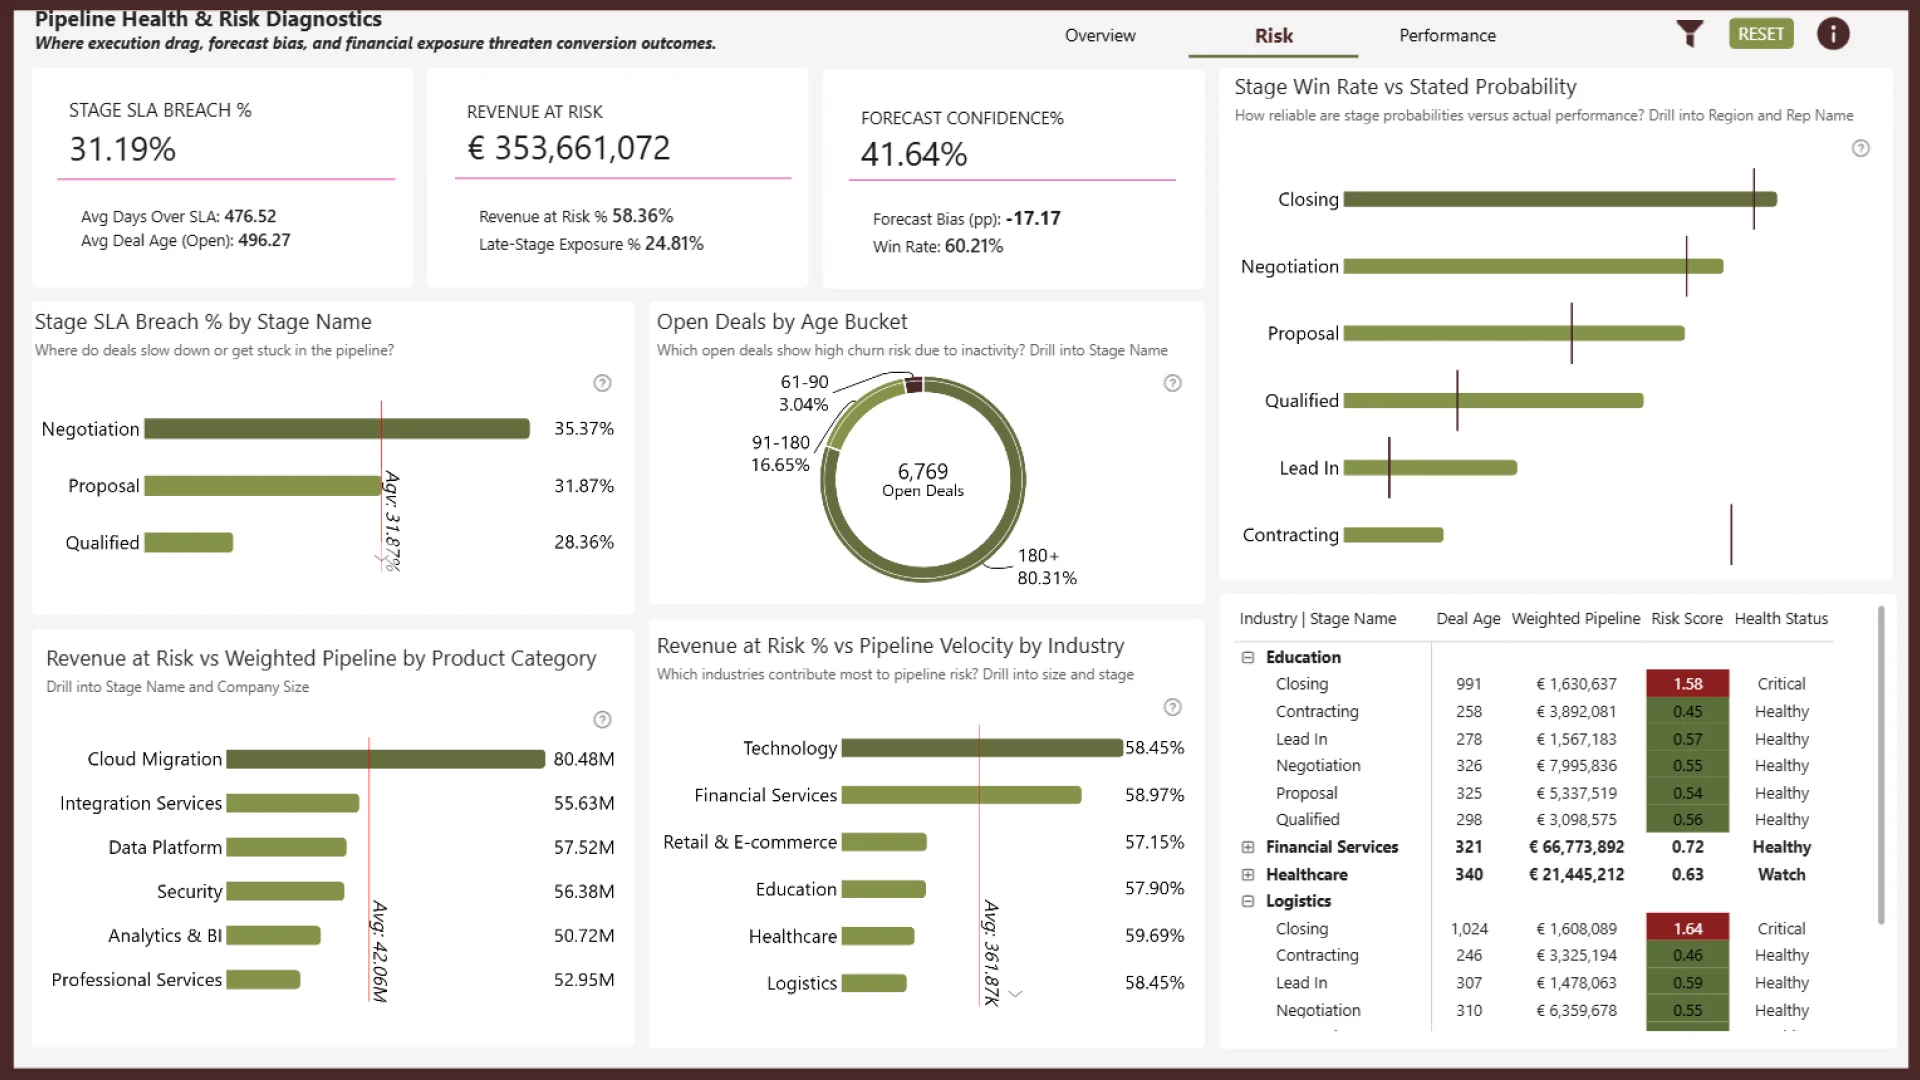
Page 2 – Pipeline Health & Risk Diagnostics focuses on identifying execution risks within the pipeline. It analyzes stage SLA breaches, deal aging, forecast confidence, probability gaps, and revenue exposure. This page helps pinpoint bottlenecks, stalled deals, and the industries contributing most to pipeline risk.
Page 3 – Sales Rep Performance evaluates the effectiveness of the sales team. It highlights representative productivity, activity efficiency, revenue generation, and conversion performance. The page also identifies top performers and examines how engagement activities impact win rates.
Together, these three pages provide a structured view of pipeline performance, operational risks, and sales productivity, supporting data-driven decision-making.
ZoomCharts visuals used
4U Report Challenges
Participate in data challenges, build and submit reports to get free template downloads.
Join CommunityMobile view allows you to interact with the report. To Download the template please switch to desktop view.
Was this helpful? Thank you for your feedback!
Sorry about that.
How can we improve it?