876
Aurora Bank emna
Aurora Bank emna
More Report pages
Report Author: Emna Toumi
876
Share template with others
Report submitted for Onyx Data DataDNA ZoomCharts Mini Challenge, December 2024. The report is based on the Aurora Bank dataset and includes ZoomCharts custom Drill Down PRO visuals for Power BI.
Authors Description
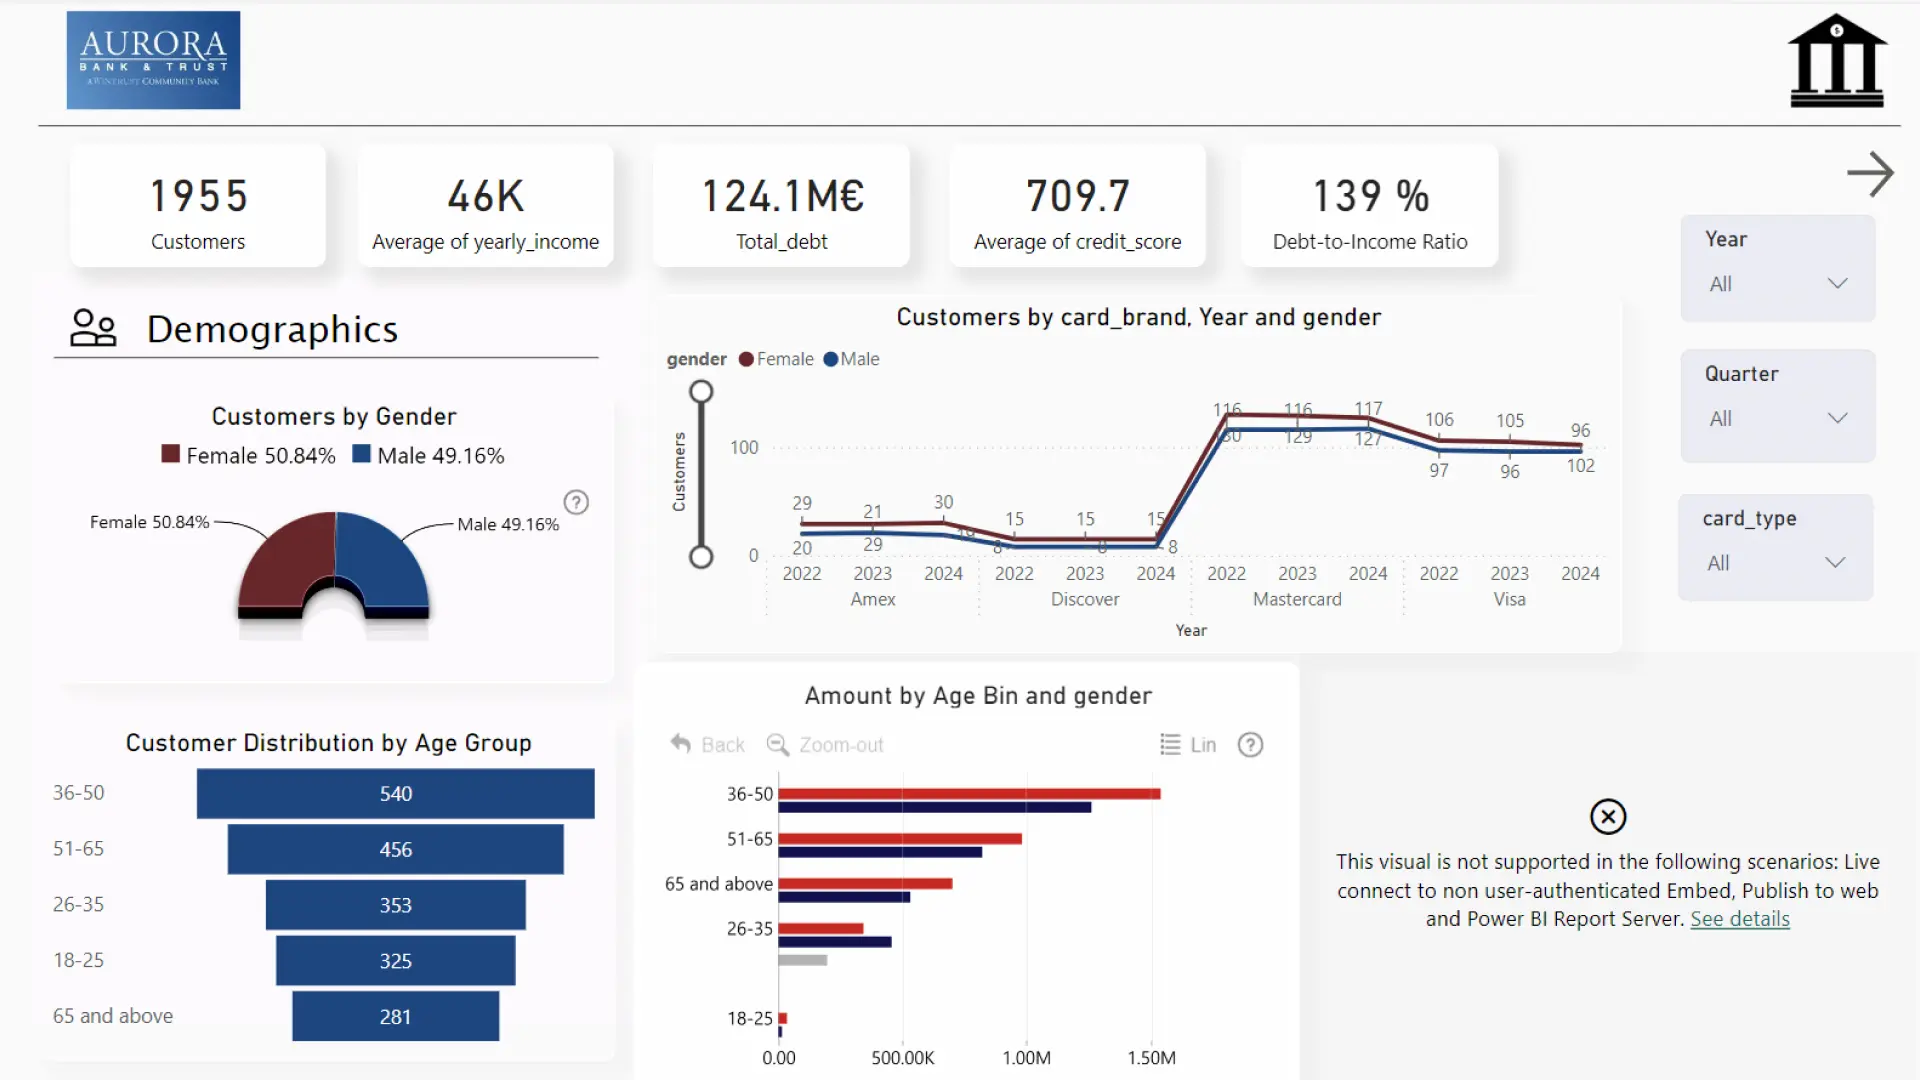
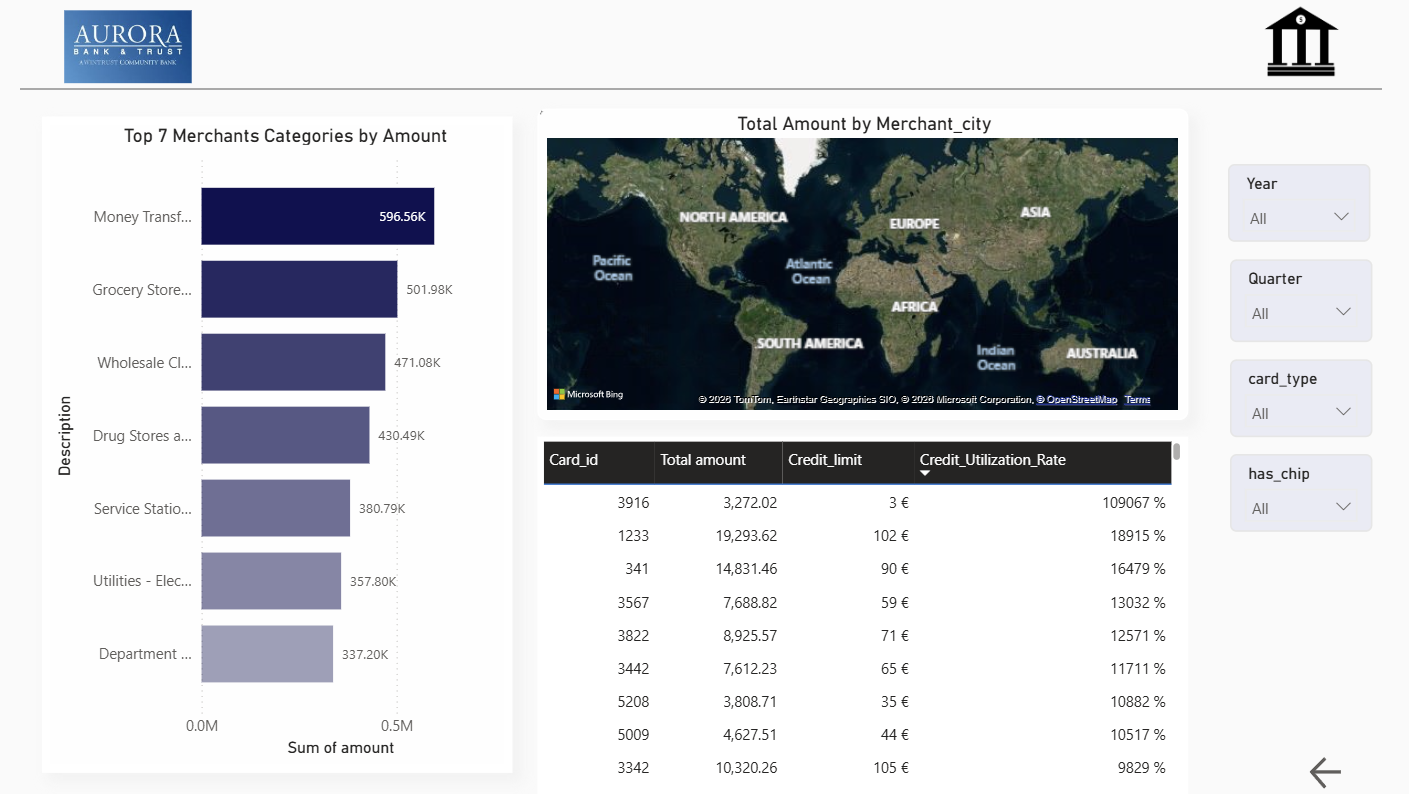
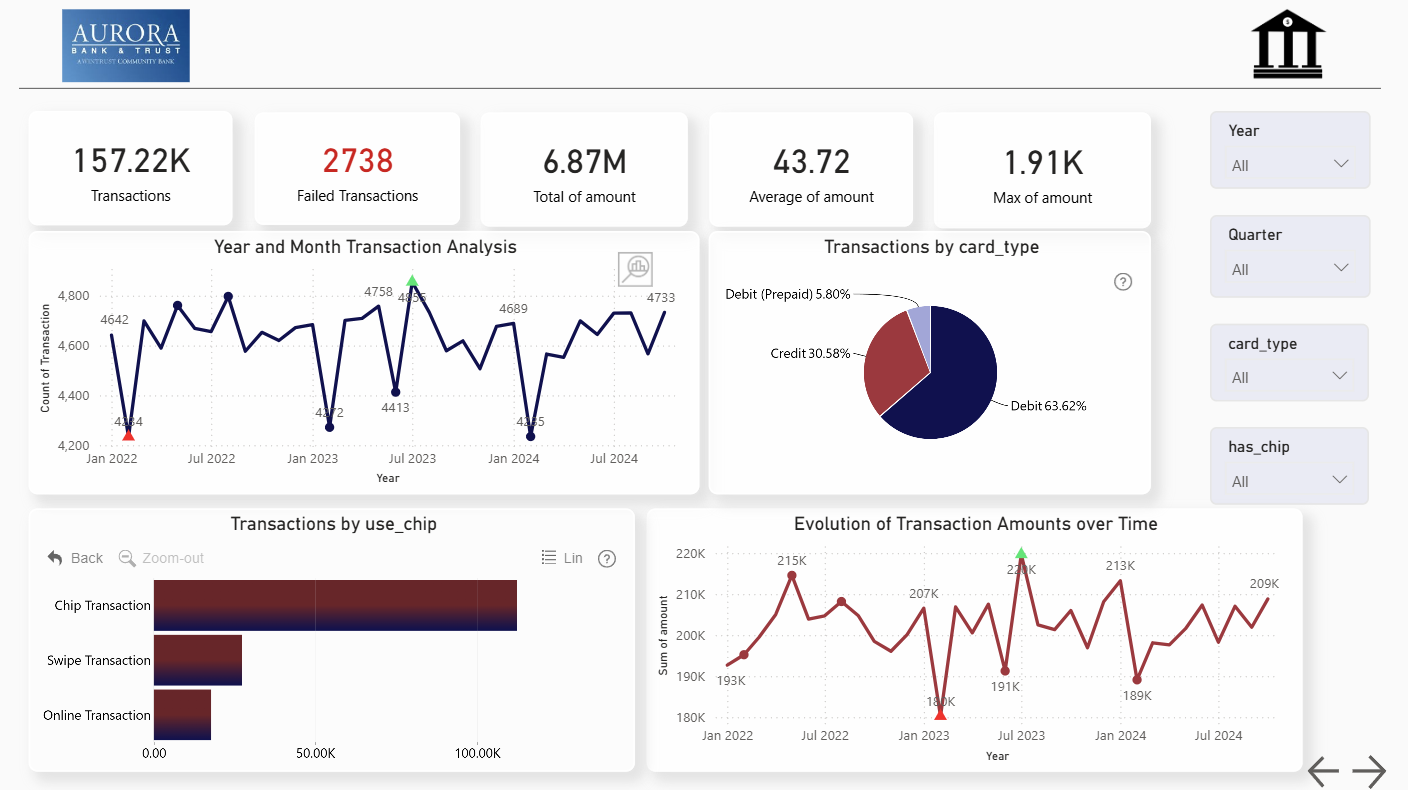
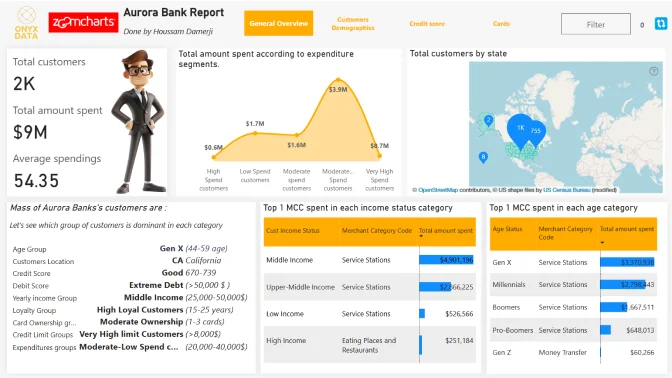
This dashboard provides a comprehensive overview of key customer and transaction metrics for Aurora Bank. It visualizes customer demographics (gender, age, location), financial health indicators (average yearly income, total debt, credit score, debt-to-income ratio), and transaction trends. Key insights include transaction volumes, failed transactions, average amounts, and monthly transaction analysis. Additionally, it tracks card usage patterns, merchant categories, and spending by city, offering valuable insights for decision-making and strategic planning.
4U Report Challenges
Participate in data challenges, build and submit reports to get free template downloads.
Join CommunityMobile view allows you to interact with the report. To Download the template please switch to desktop view.
Was this helpful? Thank you for your feedback!
Sorry about that.
How can we improve it?