1844
Athlete Health and Injury Dashboard
Athlete Health and Injury Dashboard
More Report pages
Report Author: Siddharth Gowda
1844
Share template with others
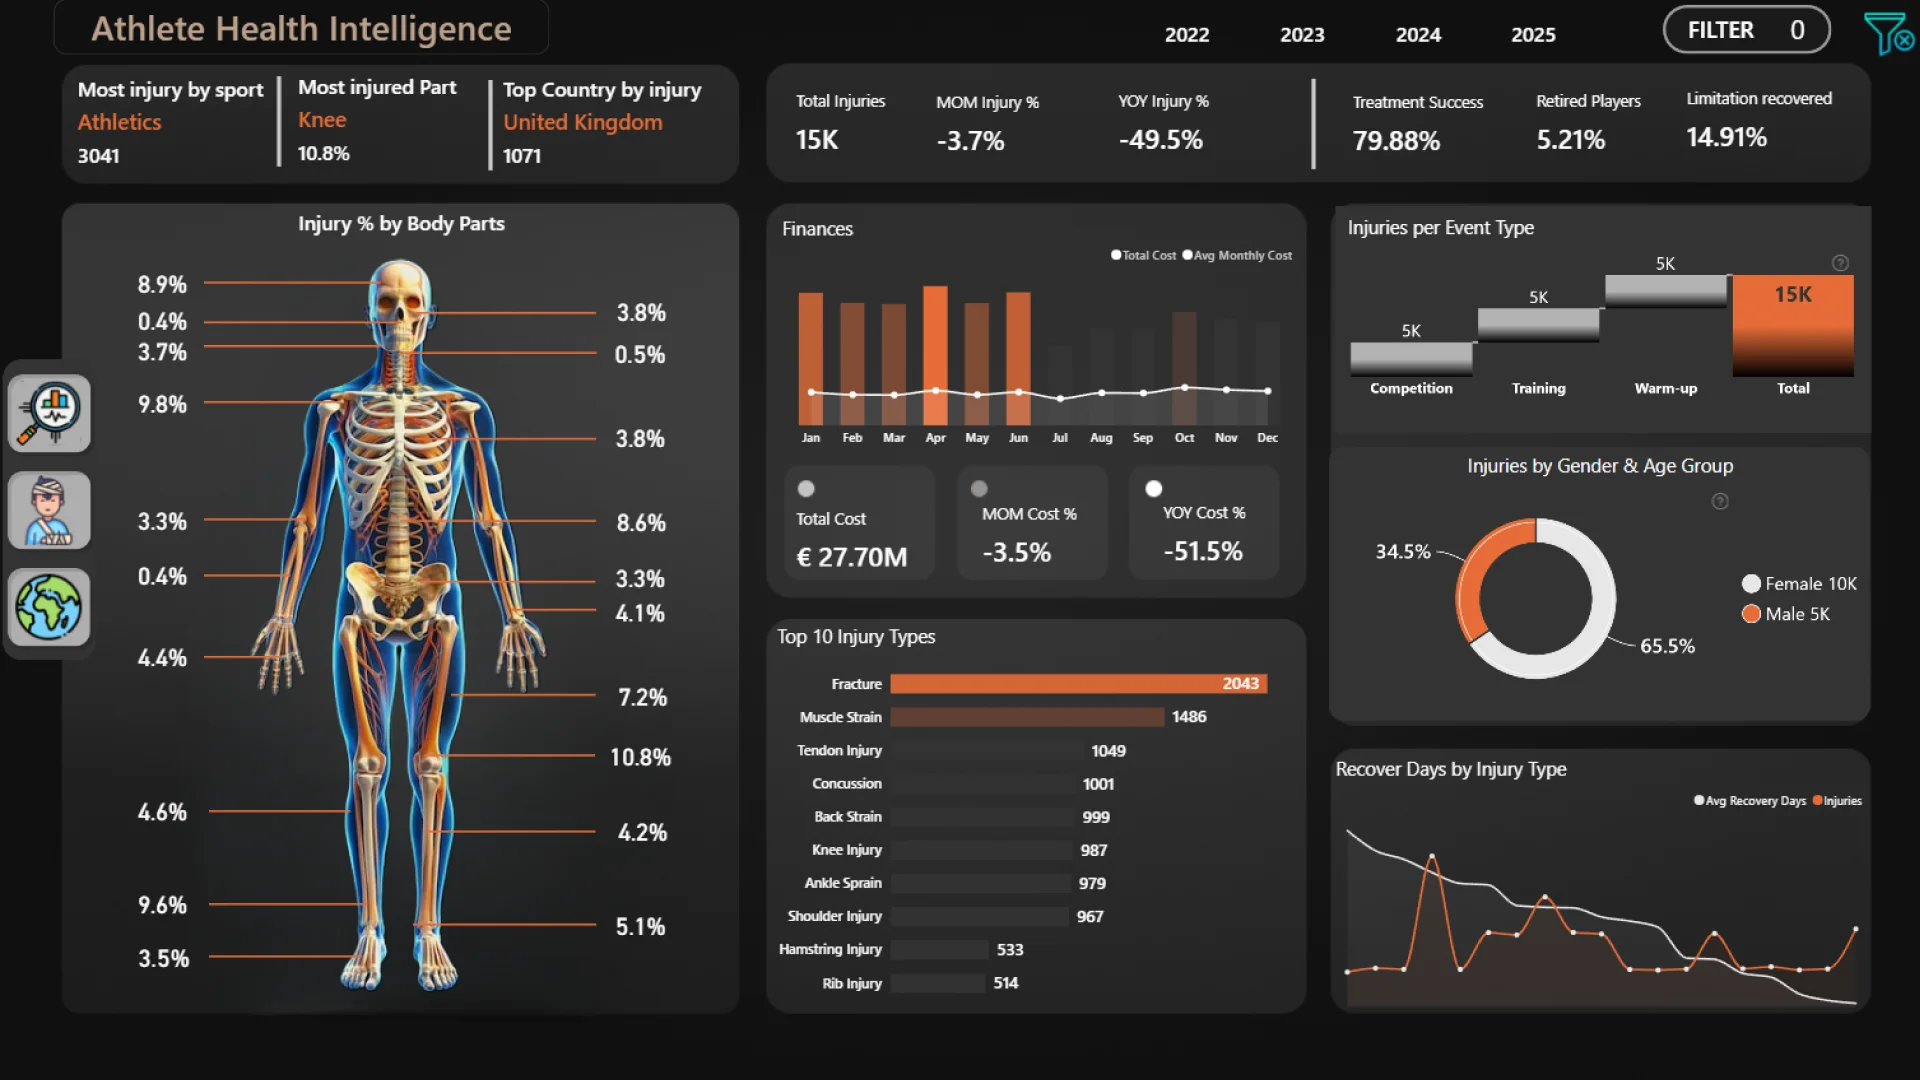
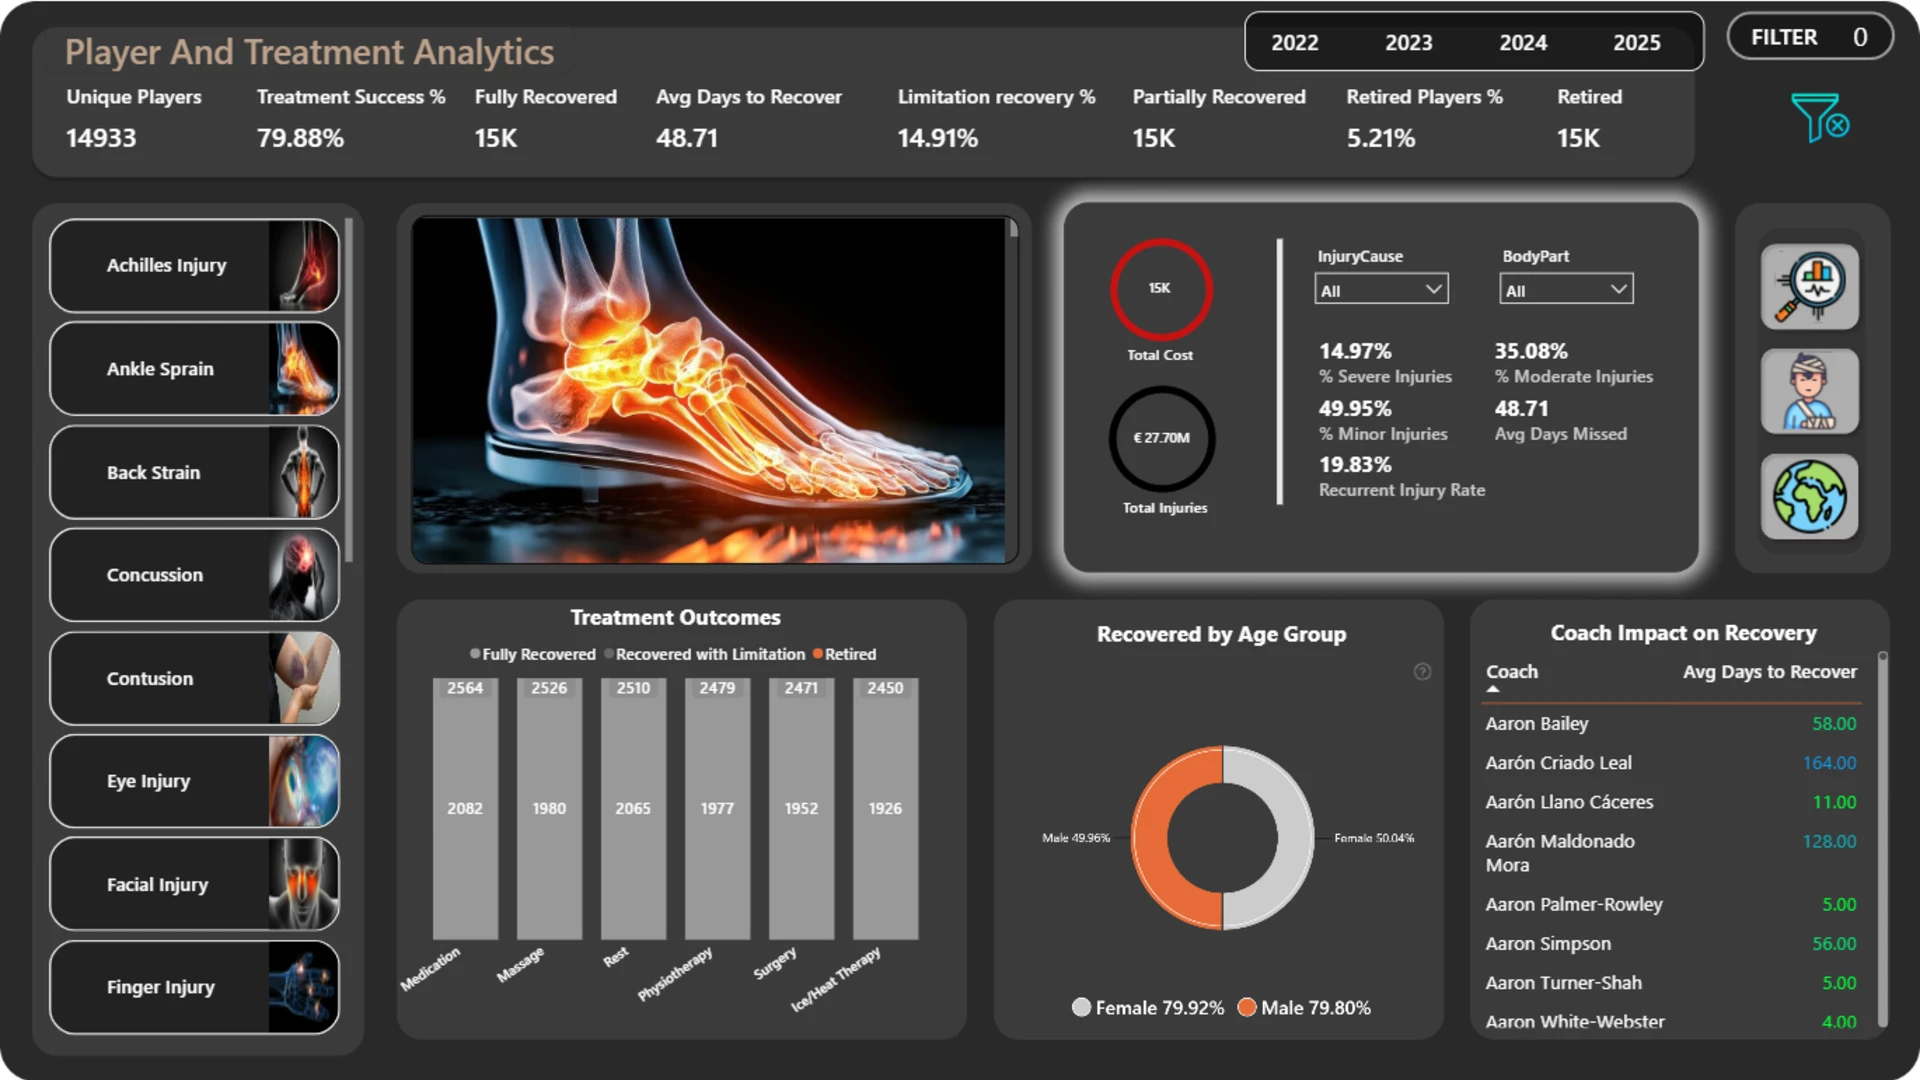
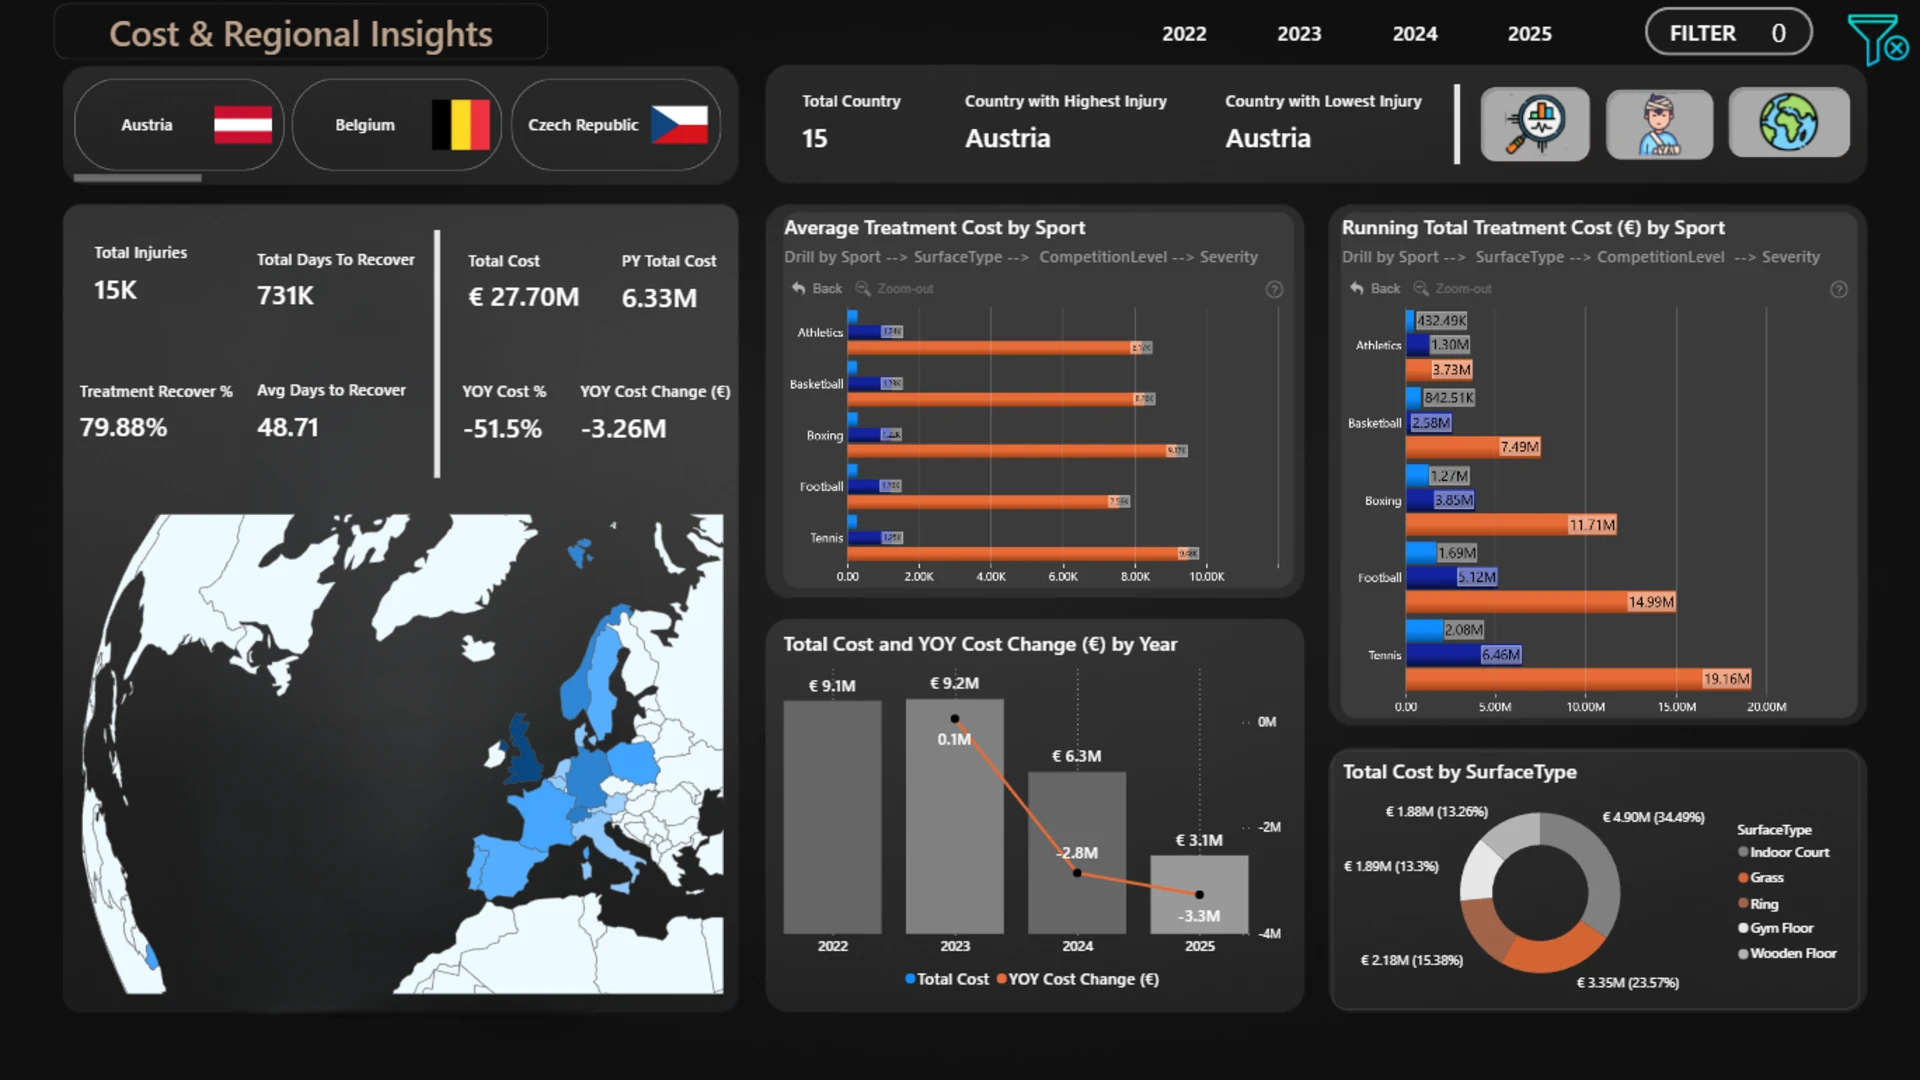
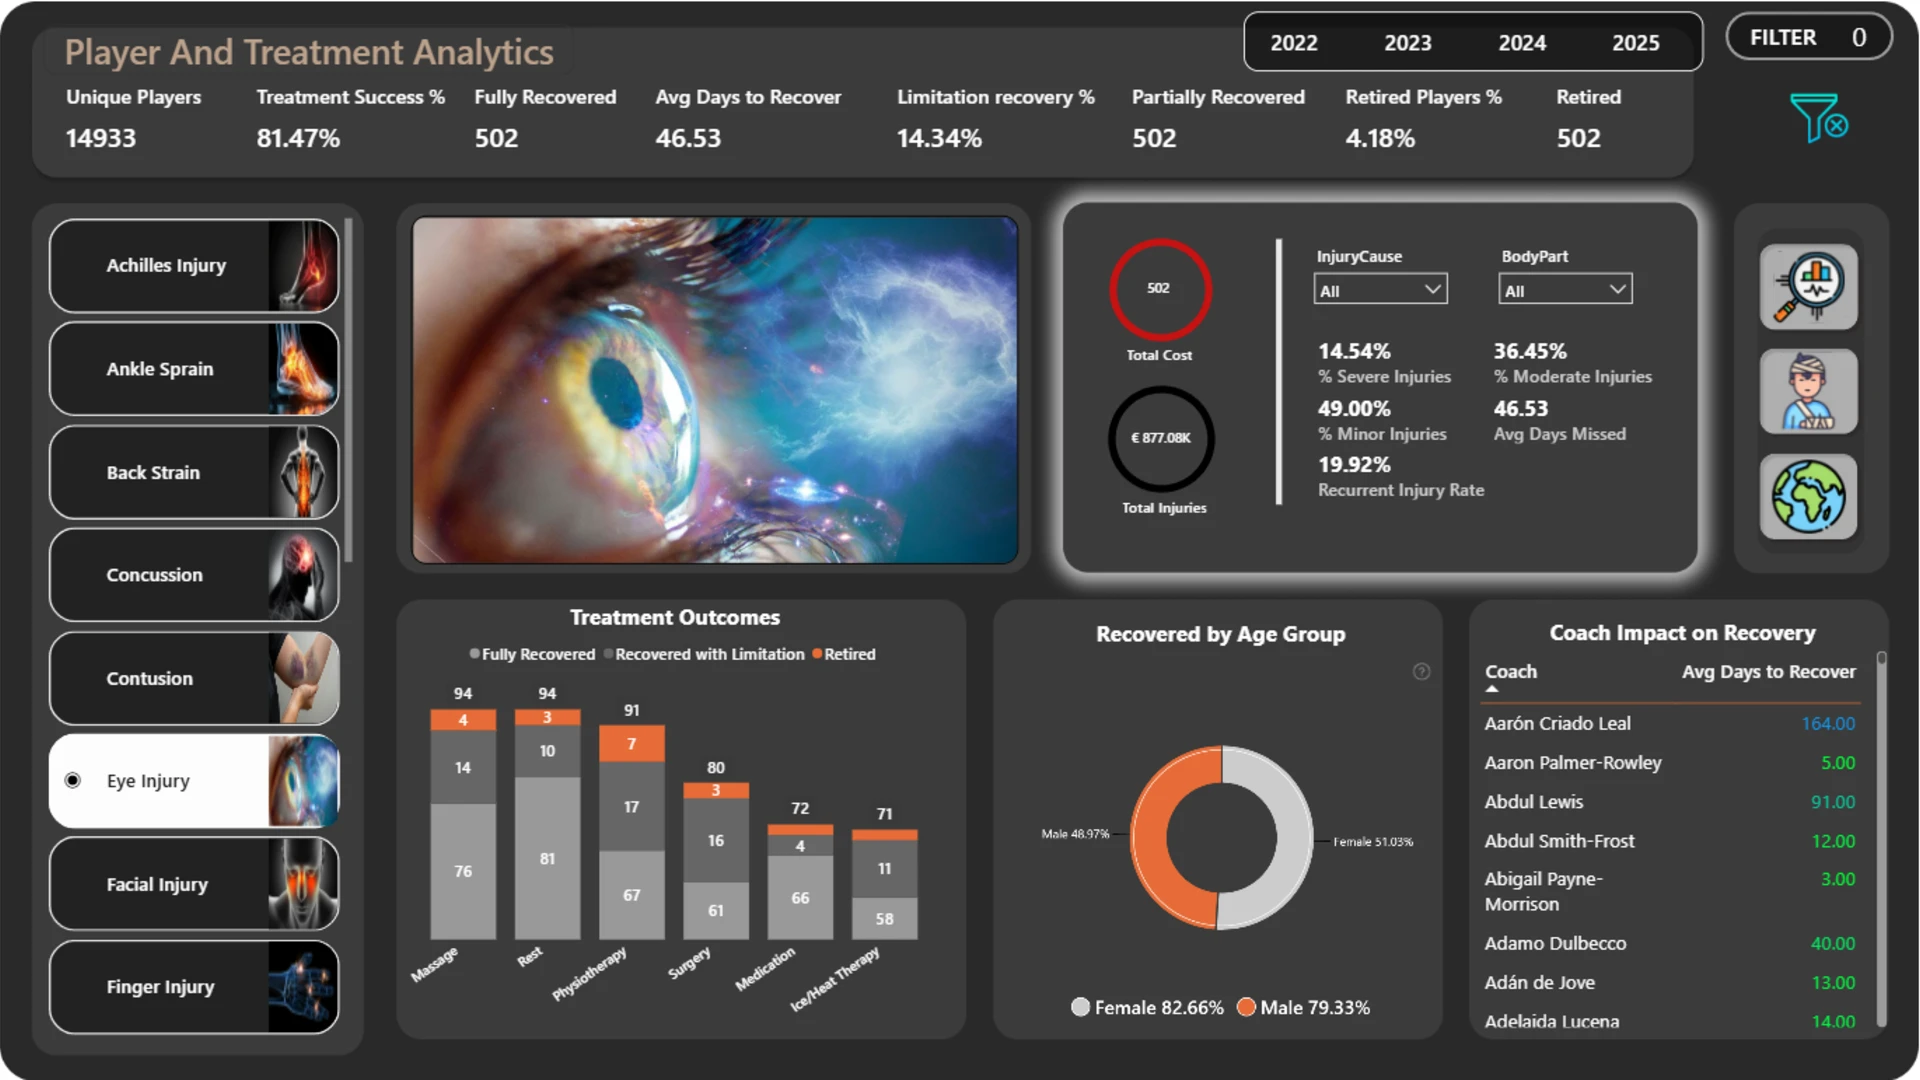
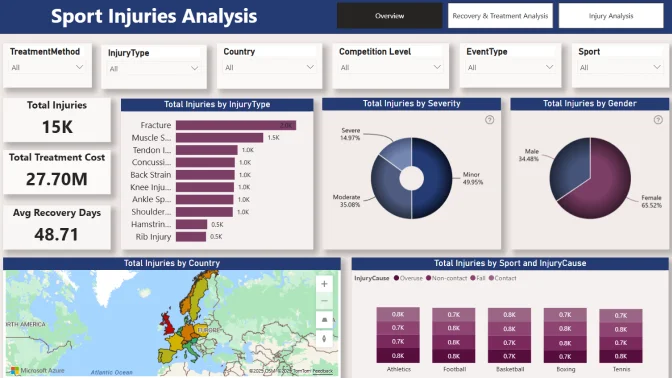
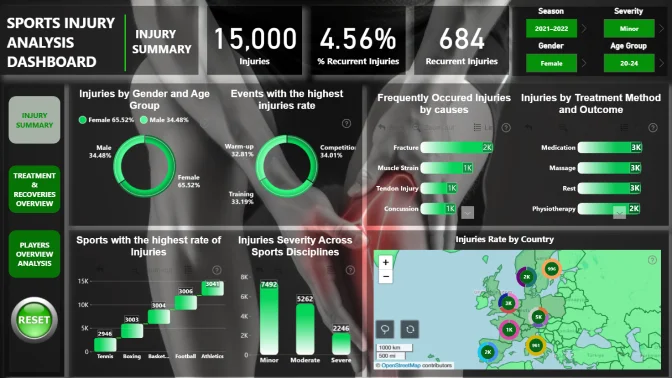
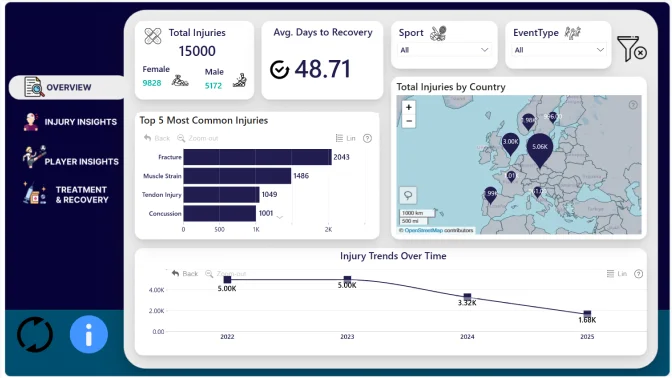
This Power BI report uses the Athlete Health and Injury dataset and features ZoomCharts Drill Down PRO custom visuals for Power BI. It was submitted to the FP20 Analytics ZoomCharts Data Challenge in August 2025.
Author's Description:
I built a Power BI report that dives into: - Injury trends highlight peak recovery delays during certain events. - Some coaches consistently have shorter recovery times, hinting at effective training methods. - Specific injury types (e.g., hamstring, ankle) are recurring and need targeted prevention. - Athletes with repeated injuries can be flagged early for proactive care. 🛠 Tools Used: Power BI ZoomCharts Custom Visuals Dynamic filtering & geo-mapping DAX for SLA analysis & resolution KPIs.



4U Report Challenges
Participate in data challenges, build and submit reports to get free template downloads.
Join CommunityMobile view allows you to interact with the report. To Download the template please switch to desktop view.
How to use a PBIX template
Preview the interactive report, download the PBIX file, open it in Power BI Desktop, and replace the same data connection with your own dataset.
Preview and download
Explore the report online and download the PBIX template file.
Open in Power BI Desktop
Open the downloaded PBIX file in Power BI Desktop.
Connect your data
Replace the sample data source with your own dataset.
Refresh and adjust
Refresh the model and update fields or visual were needed.
Save and share
Save your report and publish it for your audience.


