1145
Argentinal Fuel Market Analysis
Argentinal Fuel Market Analysis
More Report pages
Report Author: Anibal Ceballos
1145
Share template with others
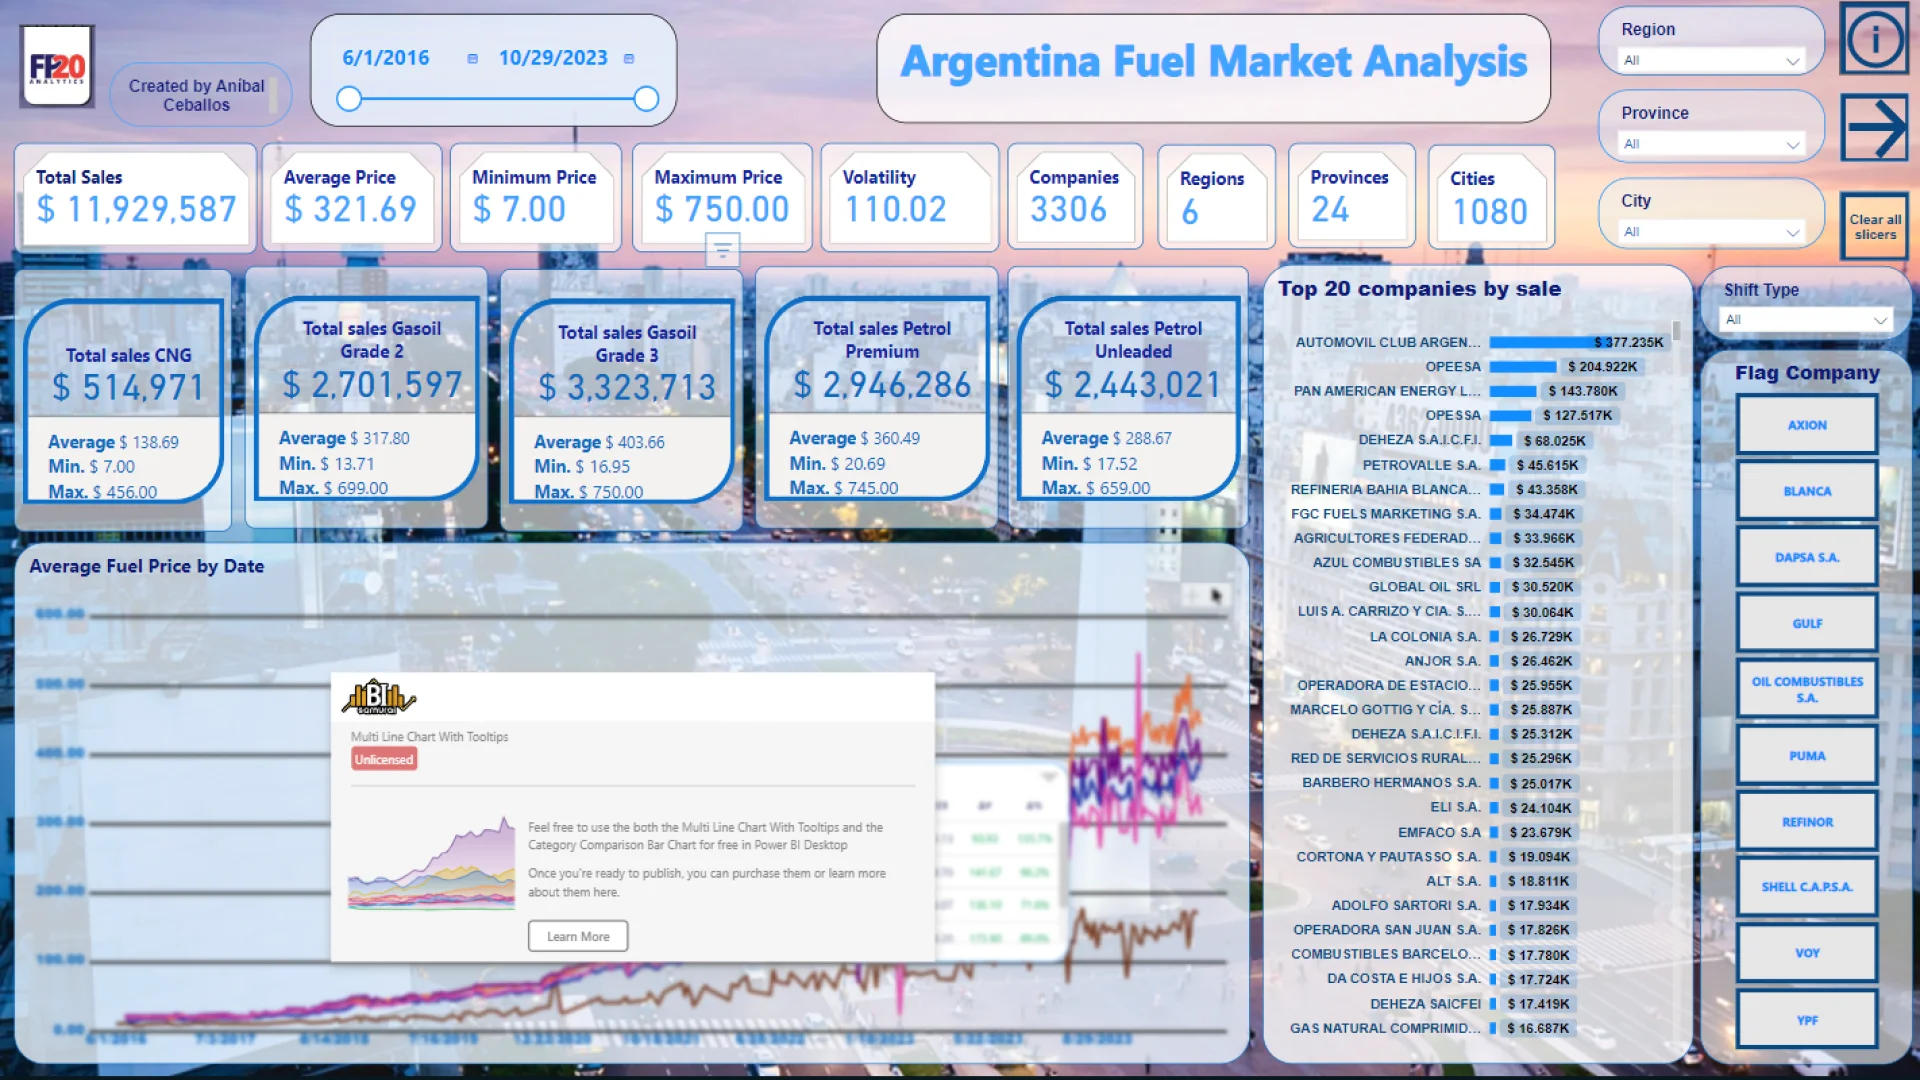
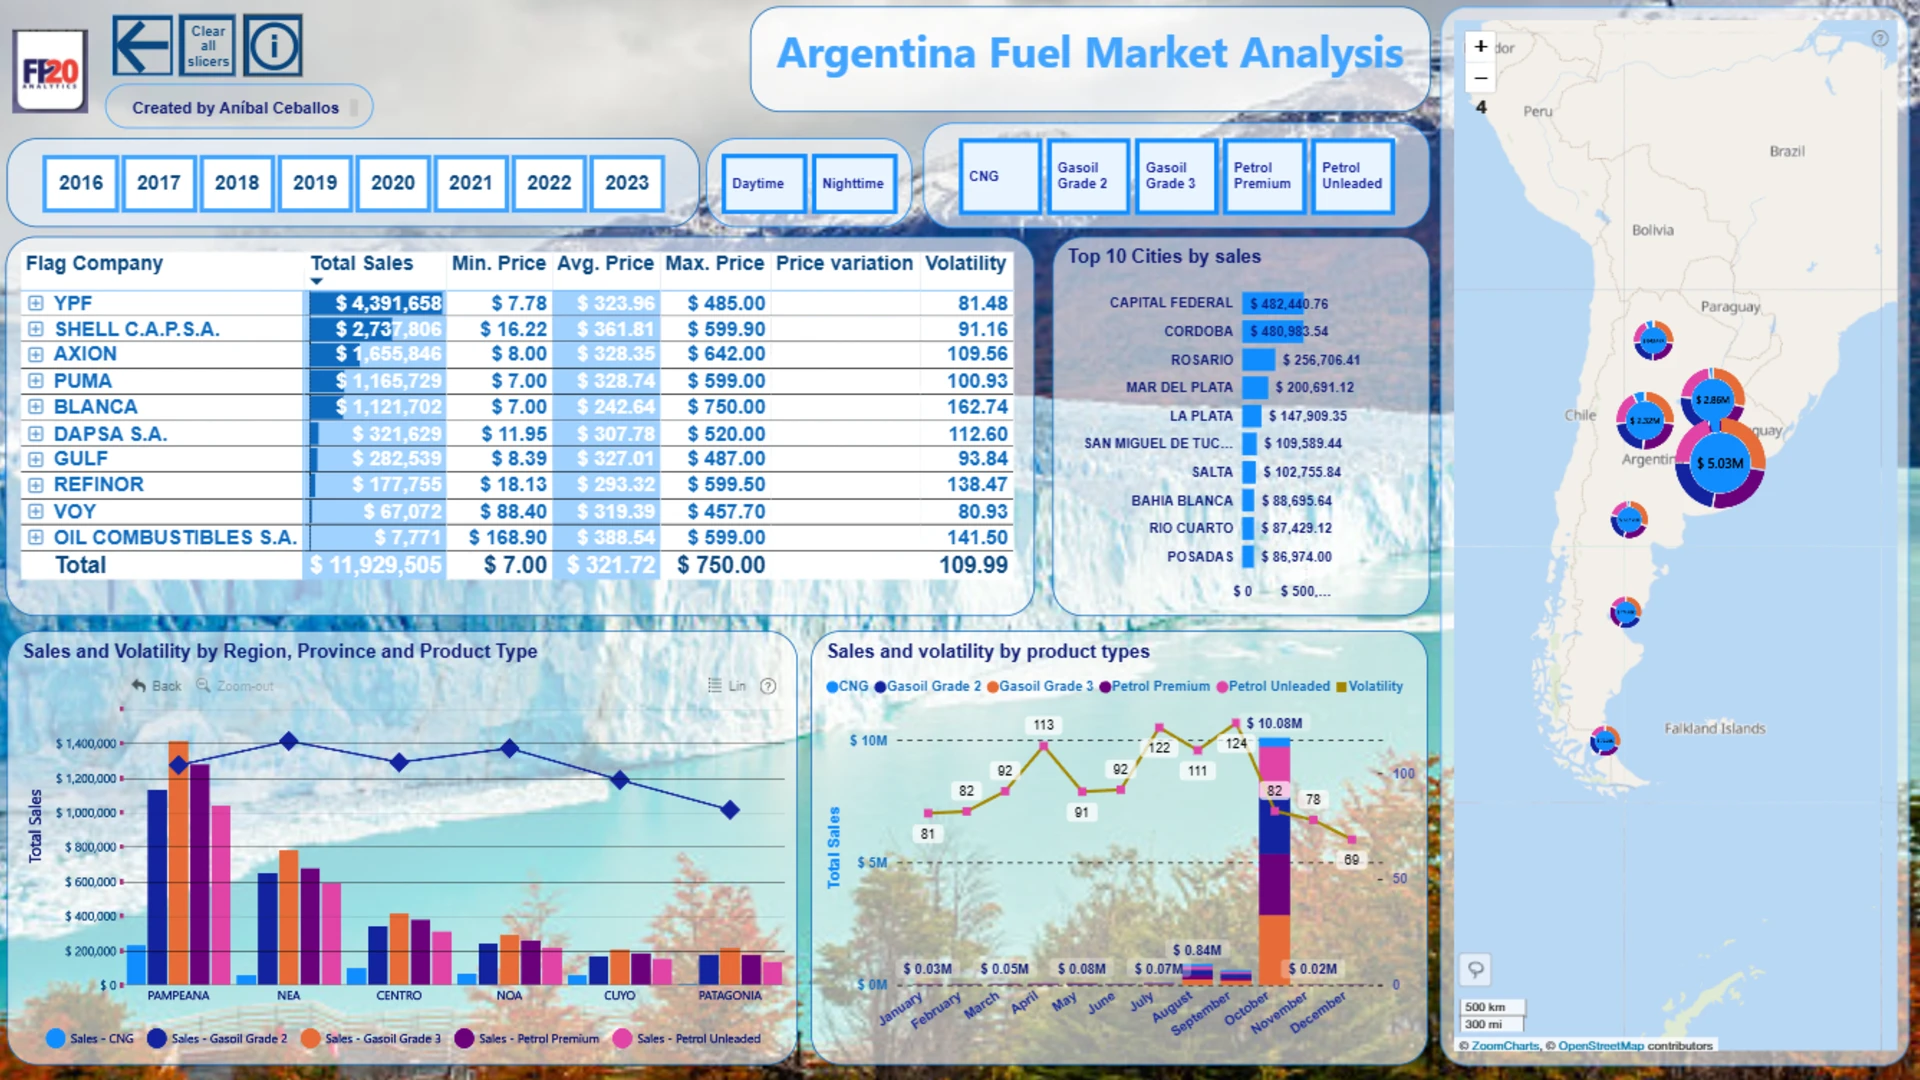
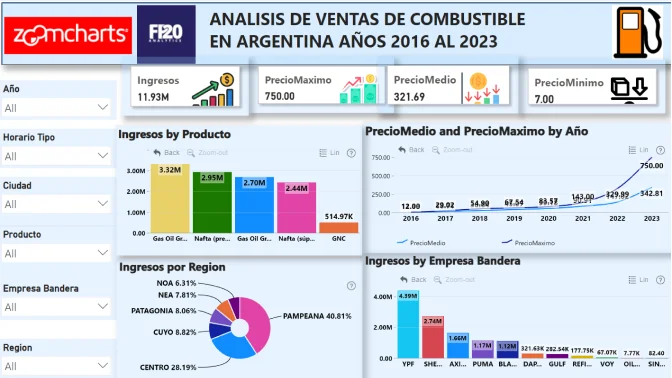
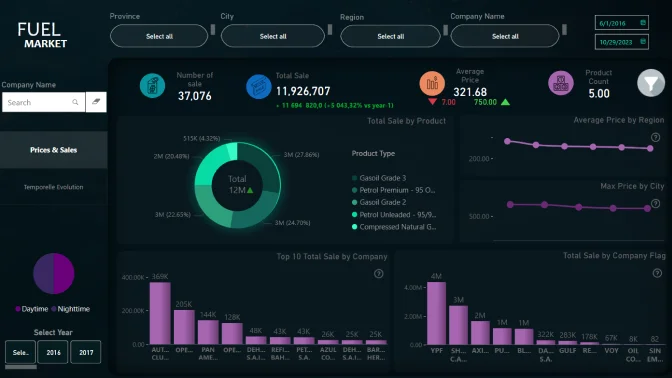
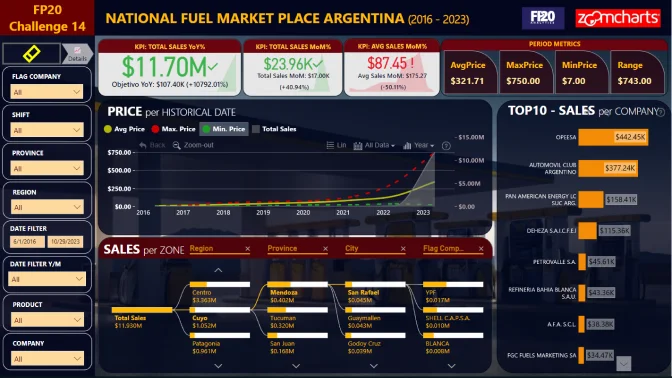
Report submitted for FP20 Analytics ZoomCharts Challenge 14 (March 2024). The report was built with the National Fuel Market Analysis dataset and includes ZoomCharts custom Drill Down PRO visuals for Power BI.
Author's description:
This challenge examines trends and market dynamics within Argentina's fuel sector over 7 years and reveals the patterns in price fluctuations, market share, and regional/ provincial variations in fuel pricing. Furthermore, it shows the sales by geographical location, flag company/company retail, and fuel type.


4U Report Challenges
Participate in data challenges, build and submit reports to get free template downloads.
Join CommunityMobile view allows you to interact with the report. To Download the template please switch to desktop view.
How to use a PBIX template
Preview the interactive report, download the PBIX file, open it in Power BI Desktop, and replace the same data connection with your own dataset.
Preview and download
Explore the report online and download the PBIX template file.
Open in Power BI Desktop
Open the downloaded PBIX file in Power BI Desktop.
Connect your data
Replace the sample data source with your own dataset.
Refresh and adjust
Refresh the model and update fields or visual were needed.
Save and share
Save your report and publish it for your audience.


