717
Animal Shelter Operations Power BI Report 2
Animal Shelter Operations Power BI Report 2
More Report pages
Report Author: Crystal Andrea Dsouza
717
Share template with others
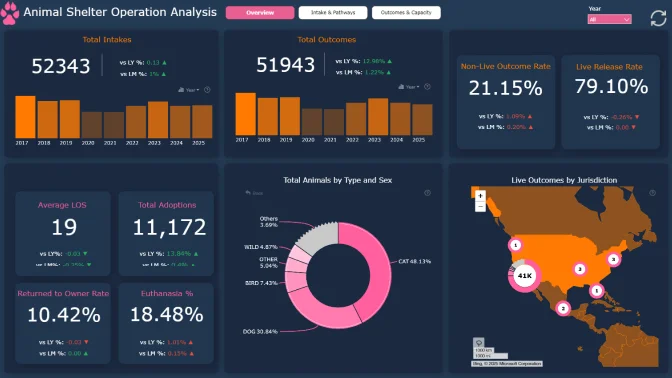
This Power BI report uses the Animal Shelter Operations dataset from a the City of Long Beach Animal Care Services, US. The report features ZoomCharts Drill Down PRO custom visuals for Power BI. It was submitted to the Onyx Data DataDNA ZoomCharts Mini Challenge in December 2025.
Author's Description:
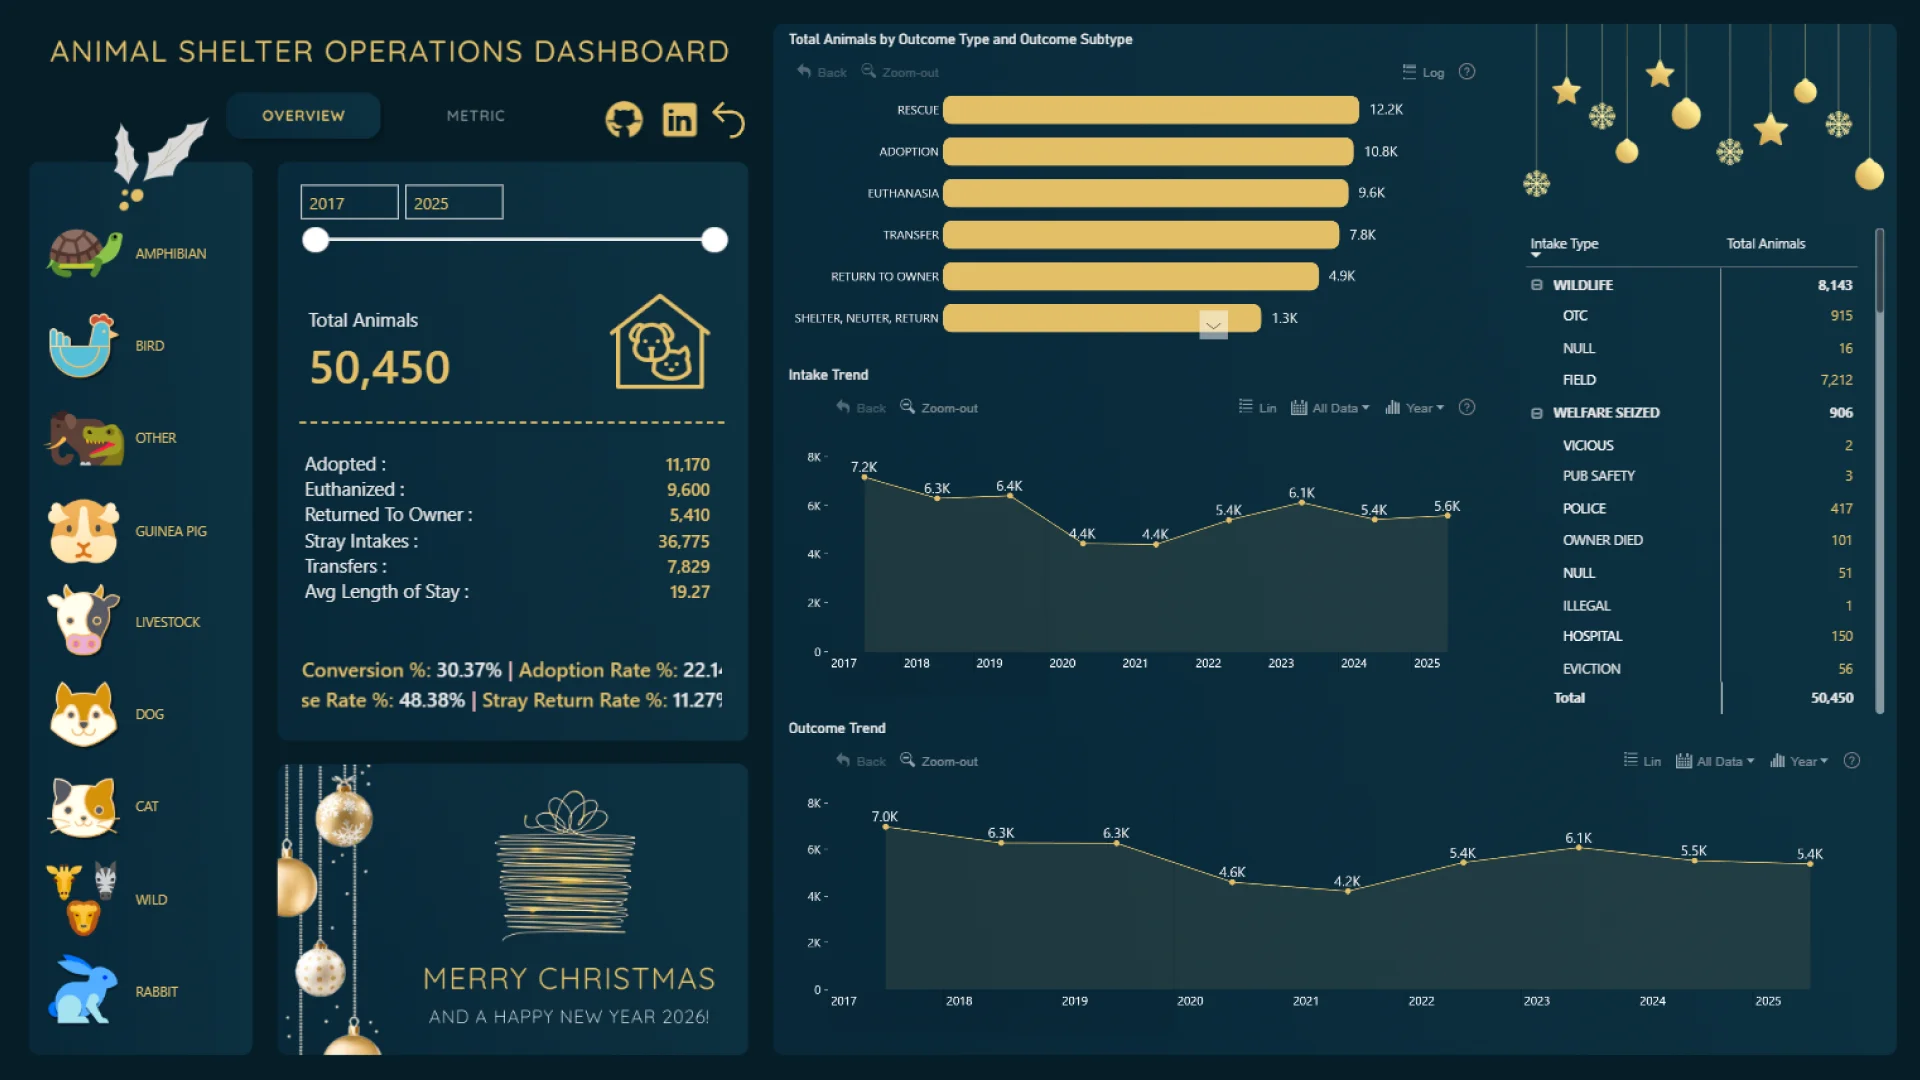
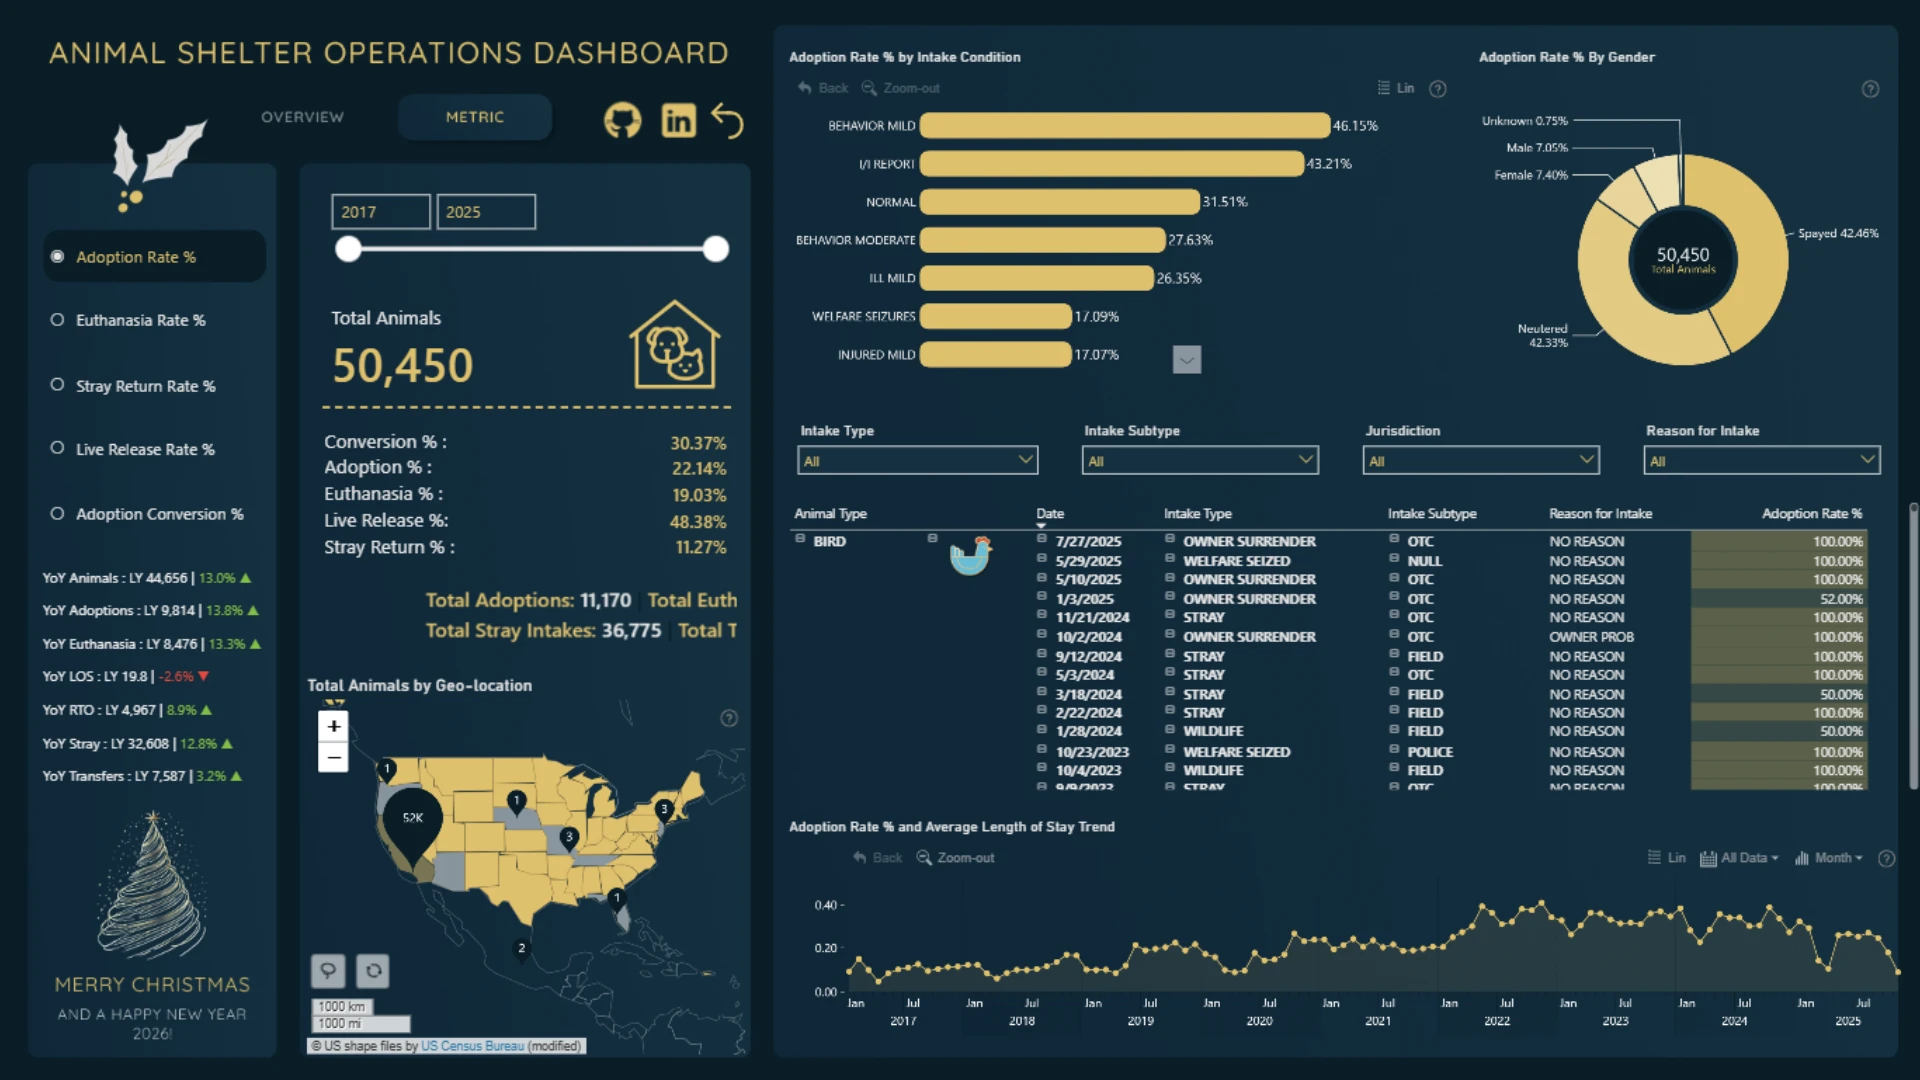
This dashboard provides a detailed overview of animal shelter operations from 2017 to 2025, highlighting key trends in intakes, outcomes, adoption performance, and shelter capacity. It presents metrics such as total animals handled, adoption conversion rates, live release rates, average length of stay, and condition-based outcome analysis. Users can explore patterns across intake types, jurisdictions, and geolocation through interactive visuals built with ZoomCharts. The dashboard features a Christmas theme to reflect the December challenge, creating a warm and engaging data storytelling experience.
ZoomCharts visuals used
4U Report Challenges
Participate in data challenges, build and submit reports to get free template downloads.
Join CommunityMobile view allows you to interact with the report. To Download the template please switch to desktop view.
Was this helpful? Thank you for your feedback!
Sorry about that.
How can we improve it?