961
Animal Shelter Operations Analysis
Animal Shelter Operations Analysis
More Report pages
Report Author: Ugochukwu Nwasuruba
961
Share template with others
This Power BI report uses the Animal Shelter Operations dataset from the City of Long Beach Animal Care Services, US. The report features ZoomCharts Drill Down PRO custom visuals for Power BI. It was submitted to the Onyx Data DataDNA ZoomCharts Mini Challenge in December 2025.
Author's Description:
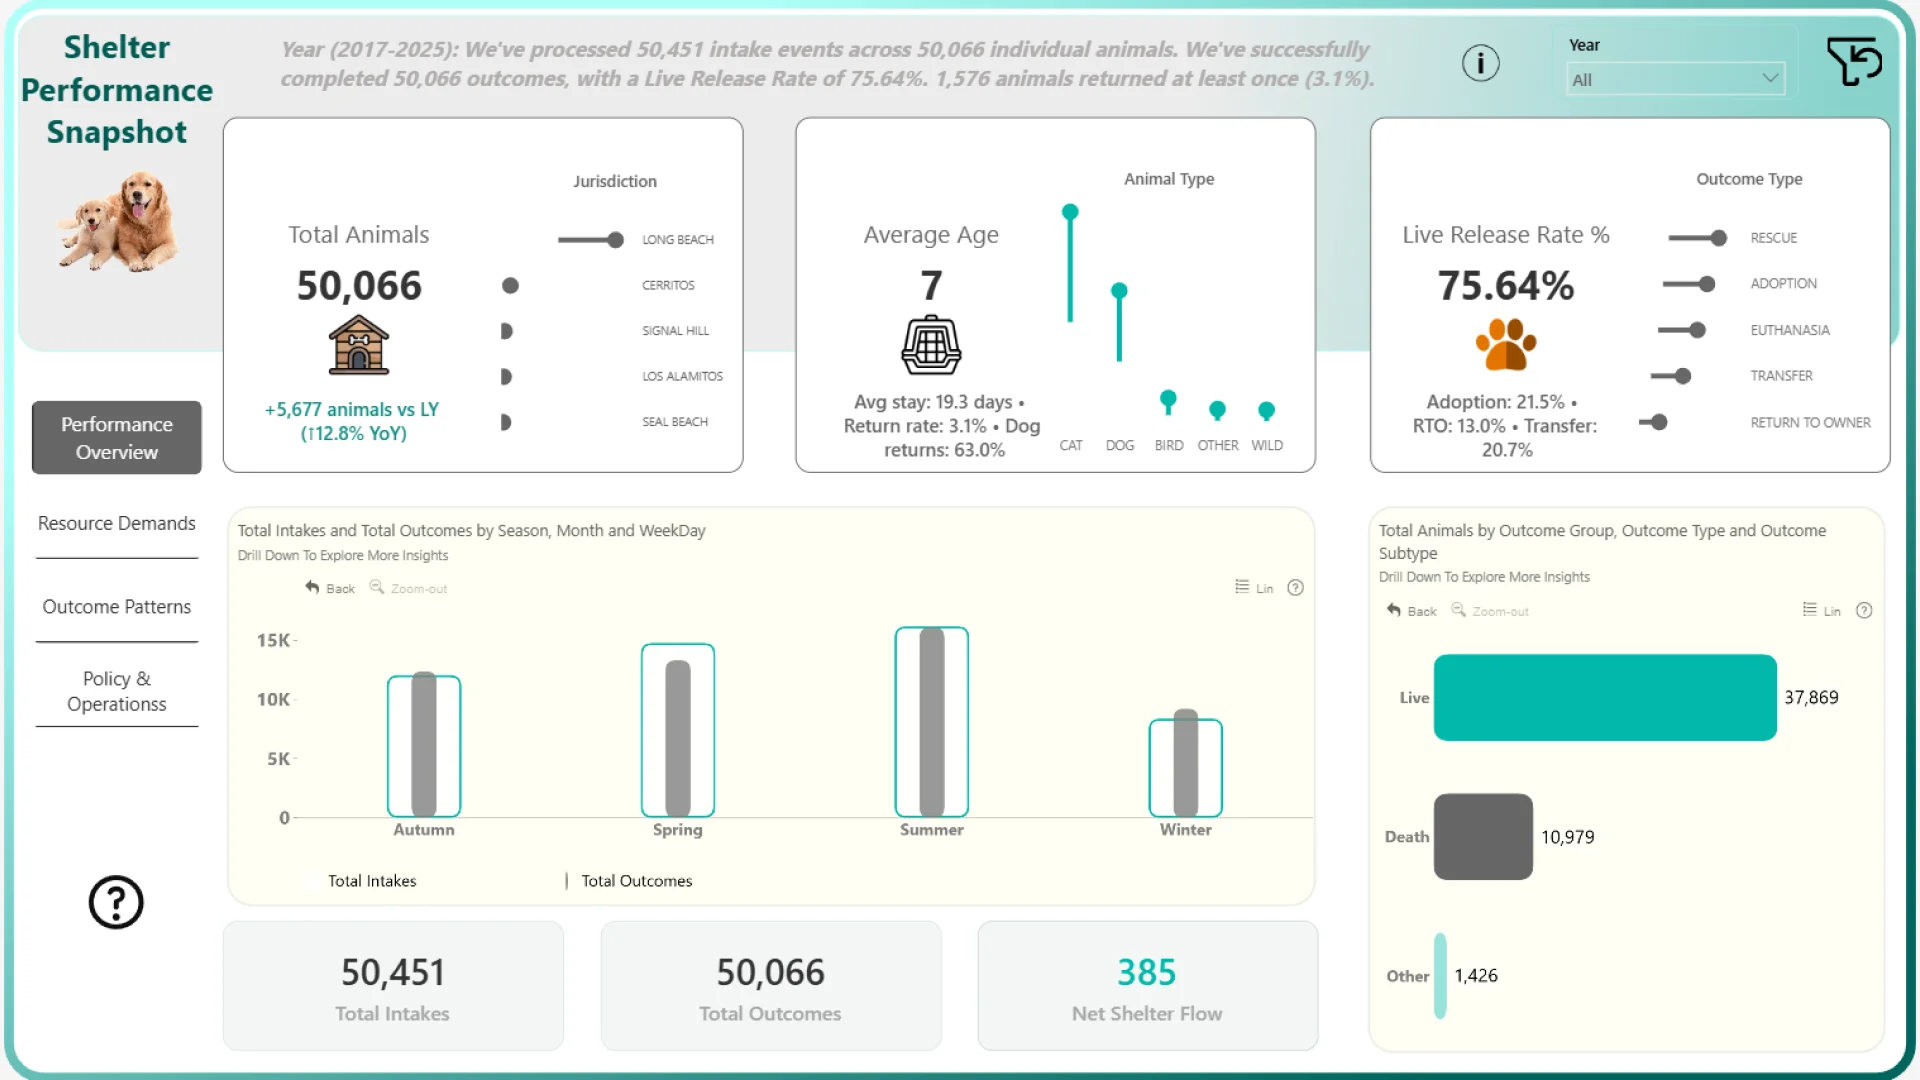
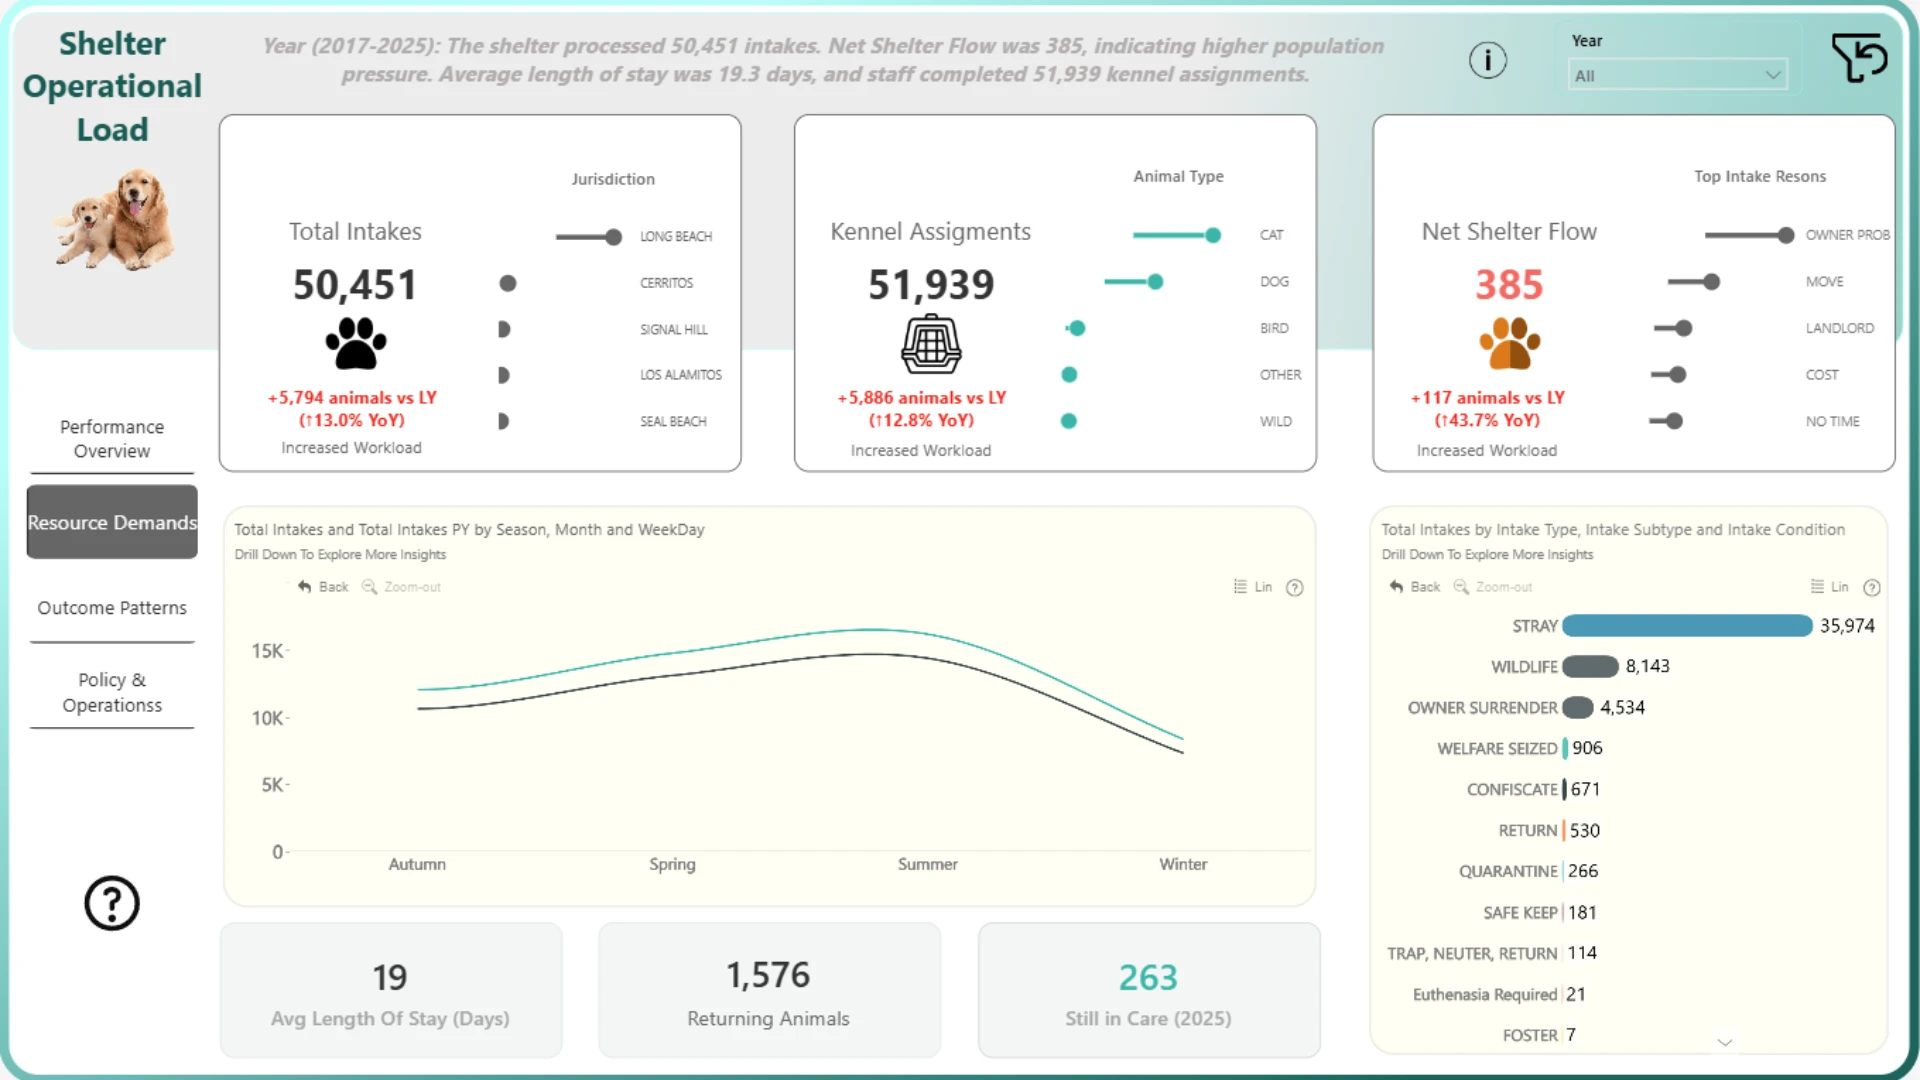
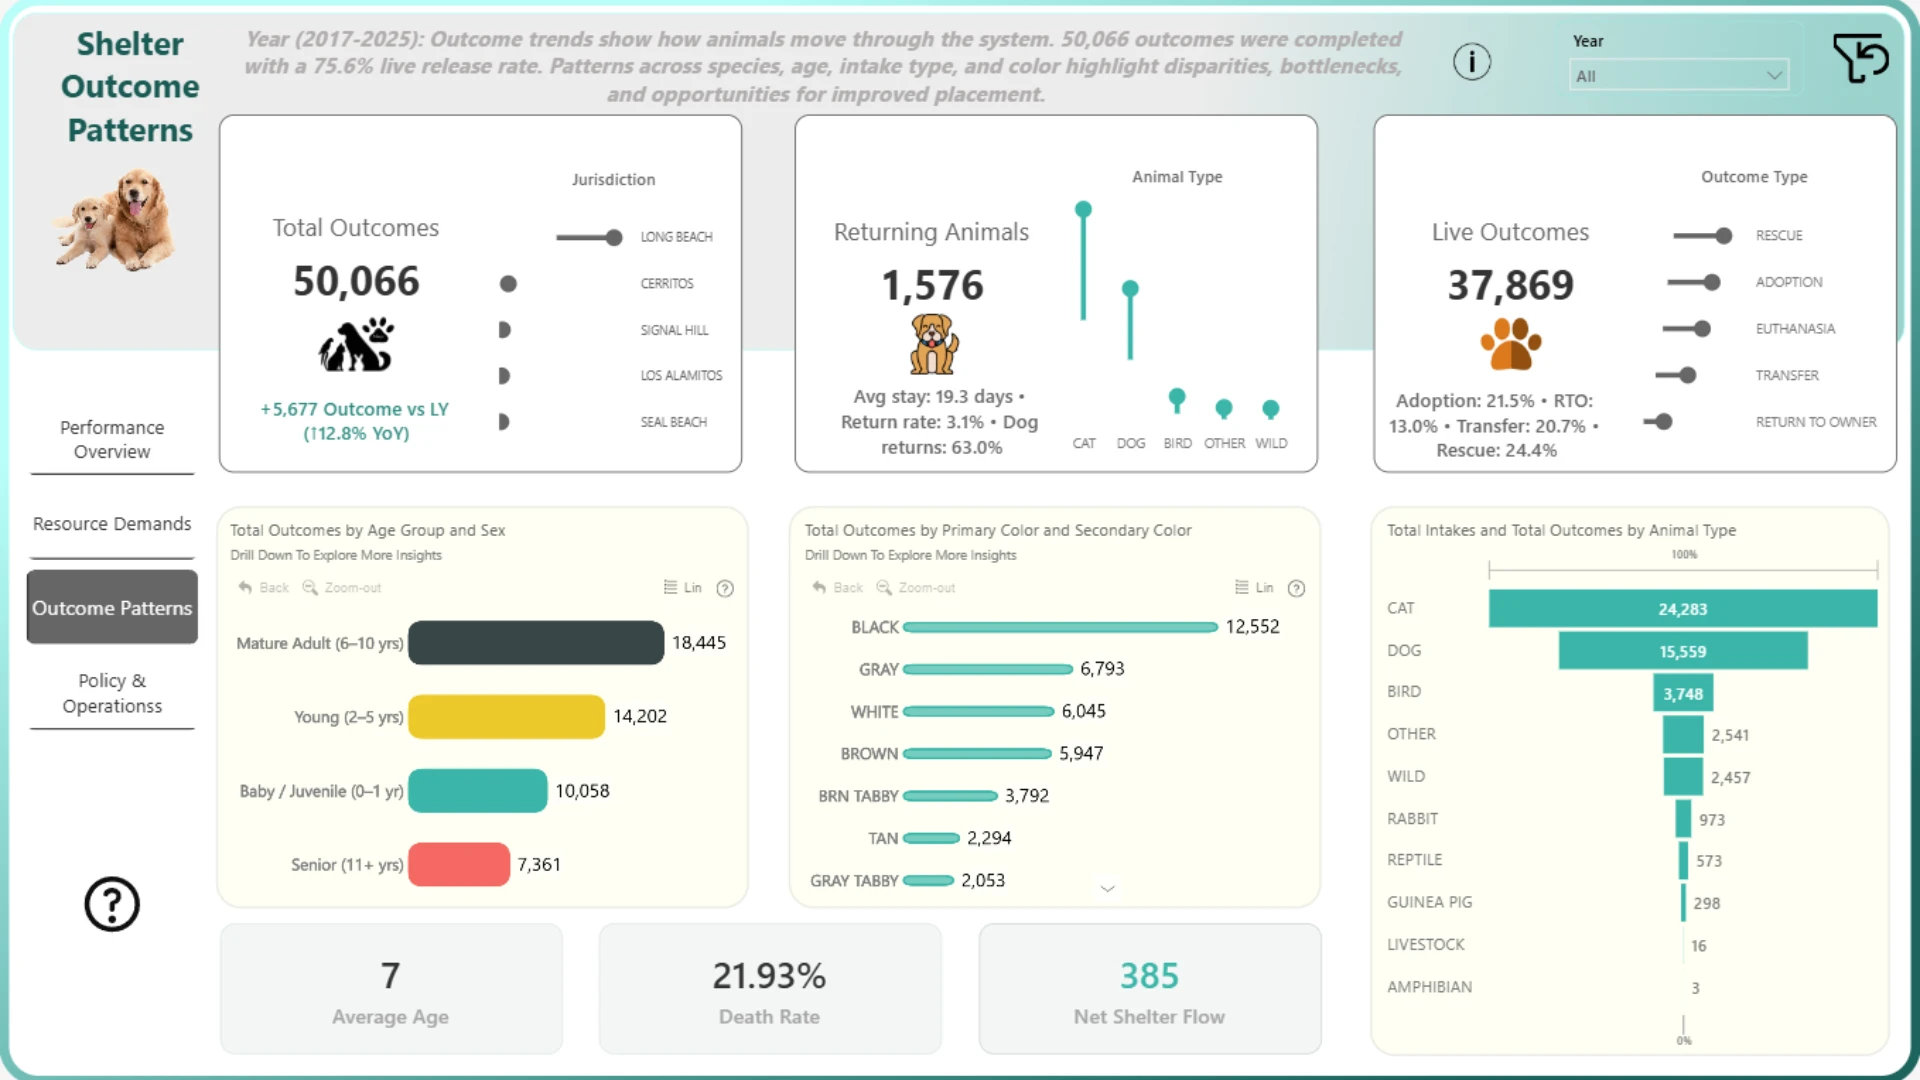
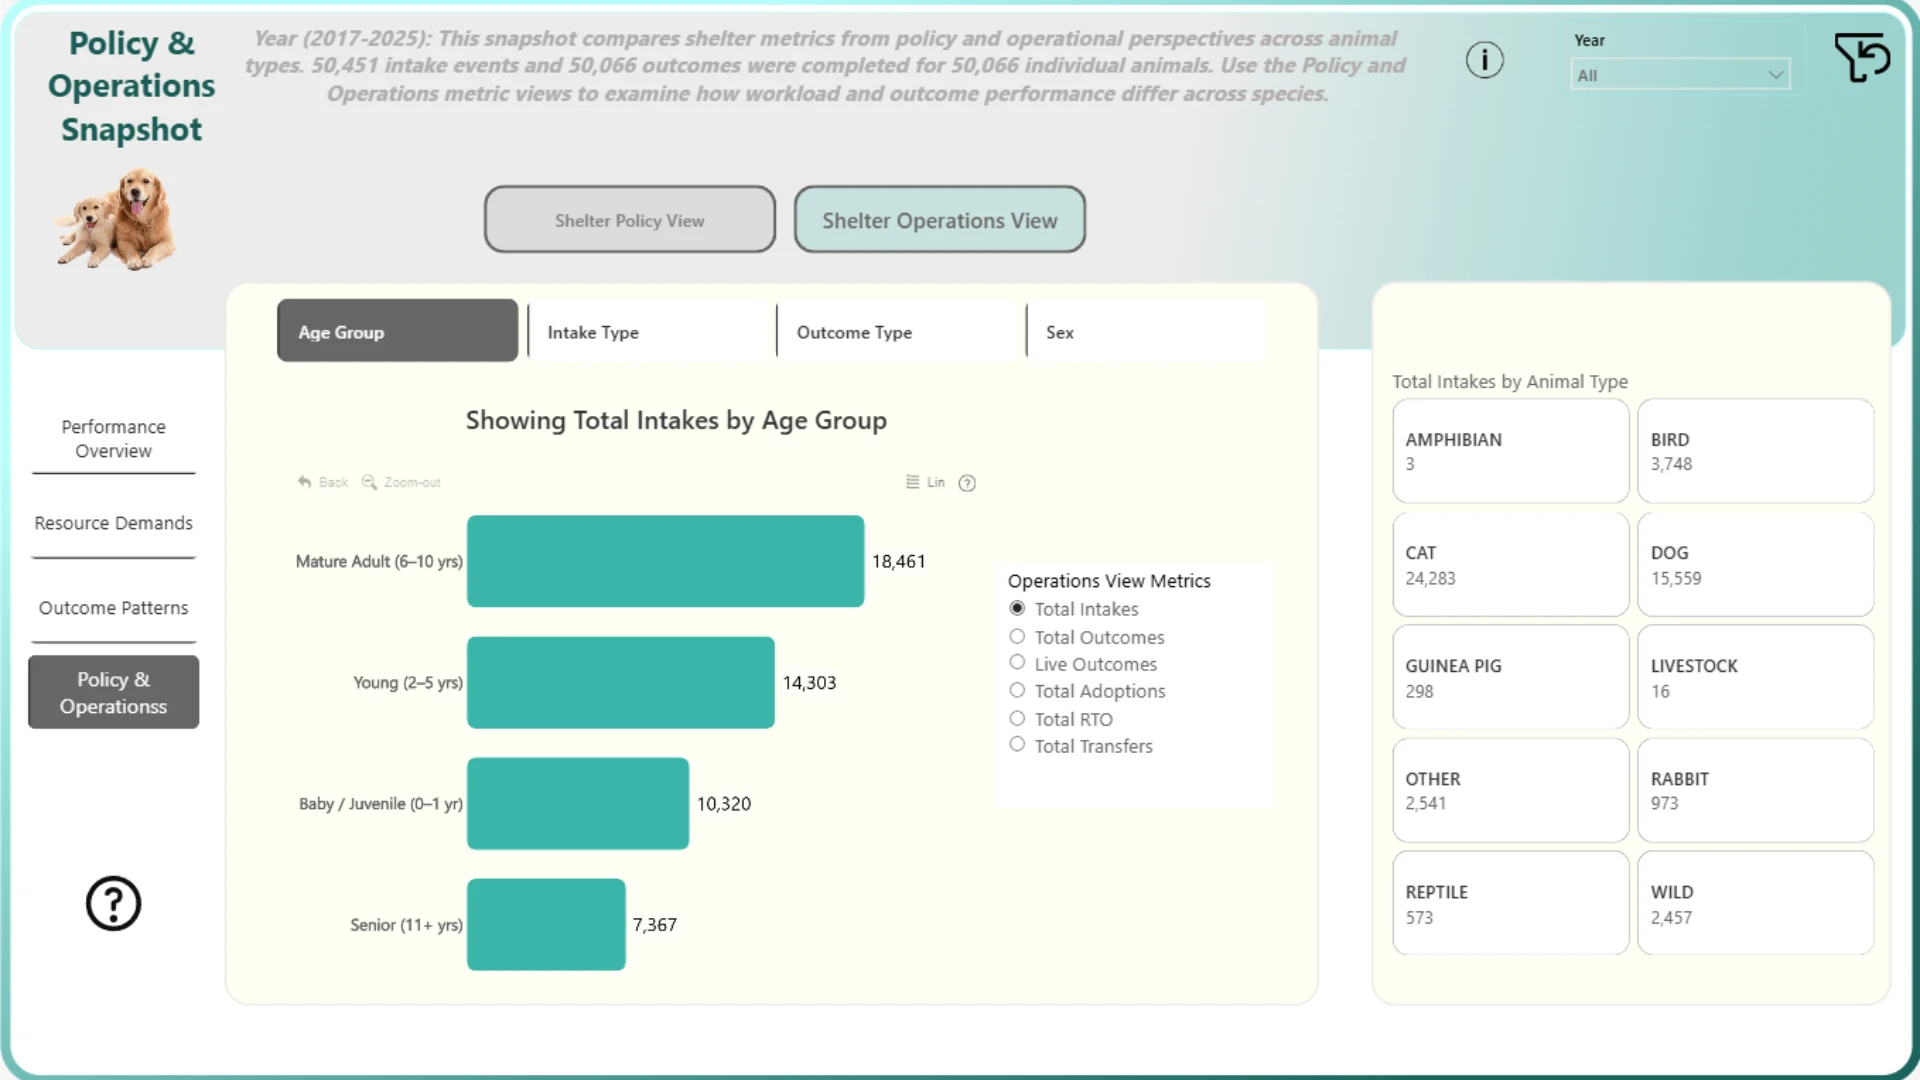
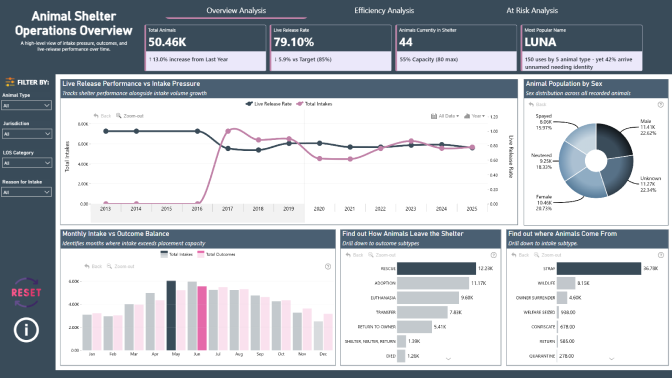
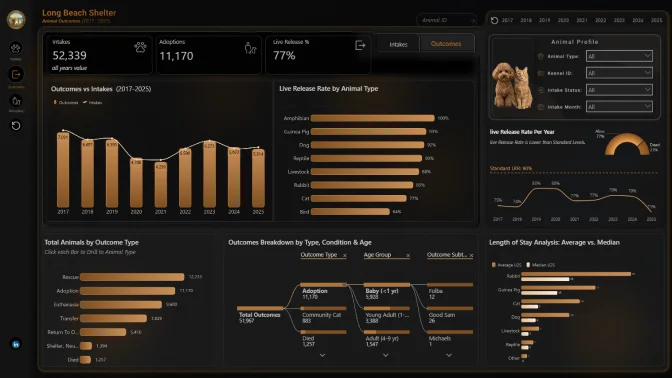
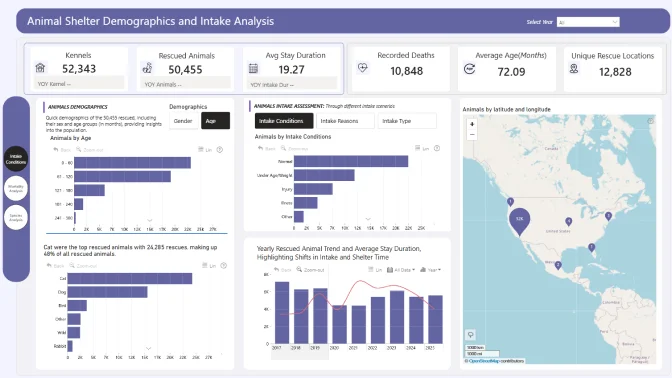
Between 2017 and 2025, the shelter processed over 50,000 animal intakes while maintaining a 75.6% live release rate. Despite strong outcomes, intake volumes increased by nearly 13% year over year, driving higher workload, longer lengths of stay, and sustained population pressure. Operational analysis shows that capacity strain is driven primarily by intake growth and time in care rather than inefficiency. Outcome patterns vary significantly by animal type, with cats driving volume and dogs driving returns. A dedicated Policy & Operations Snapshot reveals that policy success does not always align with operational workload. By separating outcome effectiveness metrics from throughput and volume metrics, the report highlights the trade-offs required to sustain performance under growing demand.


4U Report Challenges
Participate in data challenges, build and submit reports to get free template downloads.
Join CommunityMobile view allows you to interact with the report. To Download the template please switch to desktop view.
How to use a PBIX template
Preview the interactive report, download the PBIX file, open it in Power BI Desktop, and replace the same data connection with your own dataset.
Preview and download
Explore the report online and download the PBIX template file.
Open in Power BI Desktop
Open the downloaded PBIX file in Power BI Desktop.
Connect your data
Replace the sample data source with your own dataset.
Refresh and adjust
Refresh the model and update fields or visual were needed.
Save and share
Save your report and publish it for your audience.


