1145
Airline Delay Analysis Dashboard for Power BI
Airline Delay Analysis Dashboard for Power BI
Report Author: Phung Le
1145
Share template with others
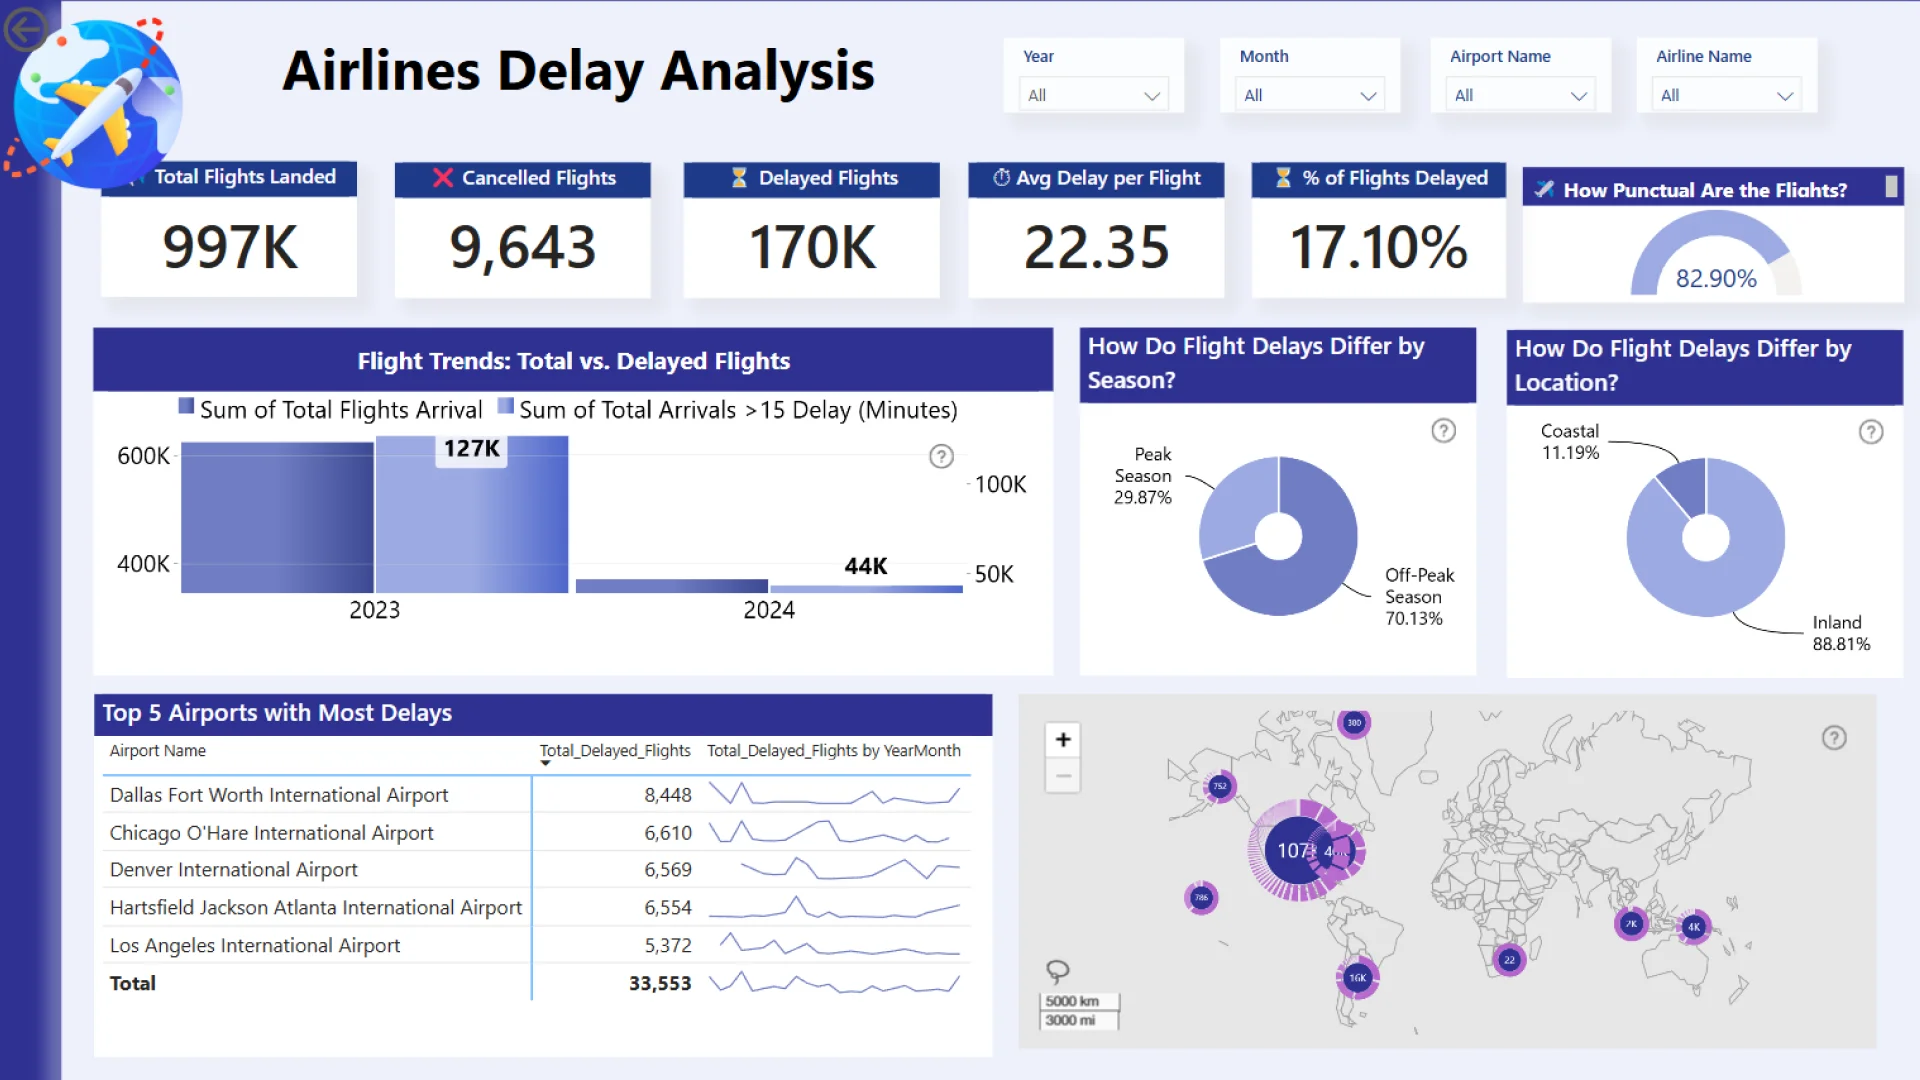
Explore flight delays, cancellations, and airline performance trends with this interactive Power BI airline delay analysis dashboard. Built with the Airline Delays Dataset and ZoomCharts Drill Down PRO visuals, the report helps users monitor total flights, delayed flights, cancellation volume, average delay time, and the percentage of delayed flights across airports, airlines, seasons, and regions.
The dashboard supports deeper analysis of delay causes, including weather, carrier issues, late aircraft, and NAS-related disruptions. Users can identify the airports and airlines most affected by delays, compare peak and off-peak travel periods, examine severe delays over 60 minutes, and use geographic heatmaps to spot regional delay patterns.
Designed for airport management, airlines, transportation analysts, and policymakers, this report helps uncover congestion periods, operational bottlenecks, and location-based performance issues that can guide better planning and flight performance improvement.
Report submitted for the FP20 Analytics ZoomCharts Challenge, January 2025. The report was built using the Airline Delays Dataset and includes ZoomCharts Drill Down PRO and native Power BI visuals.



4U Report Challenges
Participate in data challenges, build and submit reports to get free template downloads.
Join CommunityMobile view allows you to interact with the report. To Download the template please switch to desktop view.
How to use a PBIX template
Preview the interactive report, download the PBIX file, open it in Power BI Desktop, and replace the same data connection with your own dataset.
Preview and download
Explore the report online and download the PBIX template file.
Open in Power BI Desktop
Open the downloaded PBIX file in Power BI Desktop.
Connect your data
Replace the sample data source with your own dataset.
Refresh and adjust
Refresh the model and update fields or visual were needed.
Save and share
Save your report and publish it for your audience.


