5443
Transport & Logistics Performance Dashboard
Transport & Logistics Performance Dashboard
More Report pages
Report Author: Ugochukwu Nwasuruba
5443
Share template with others
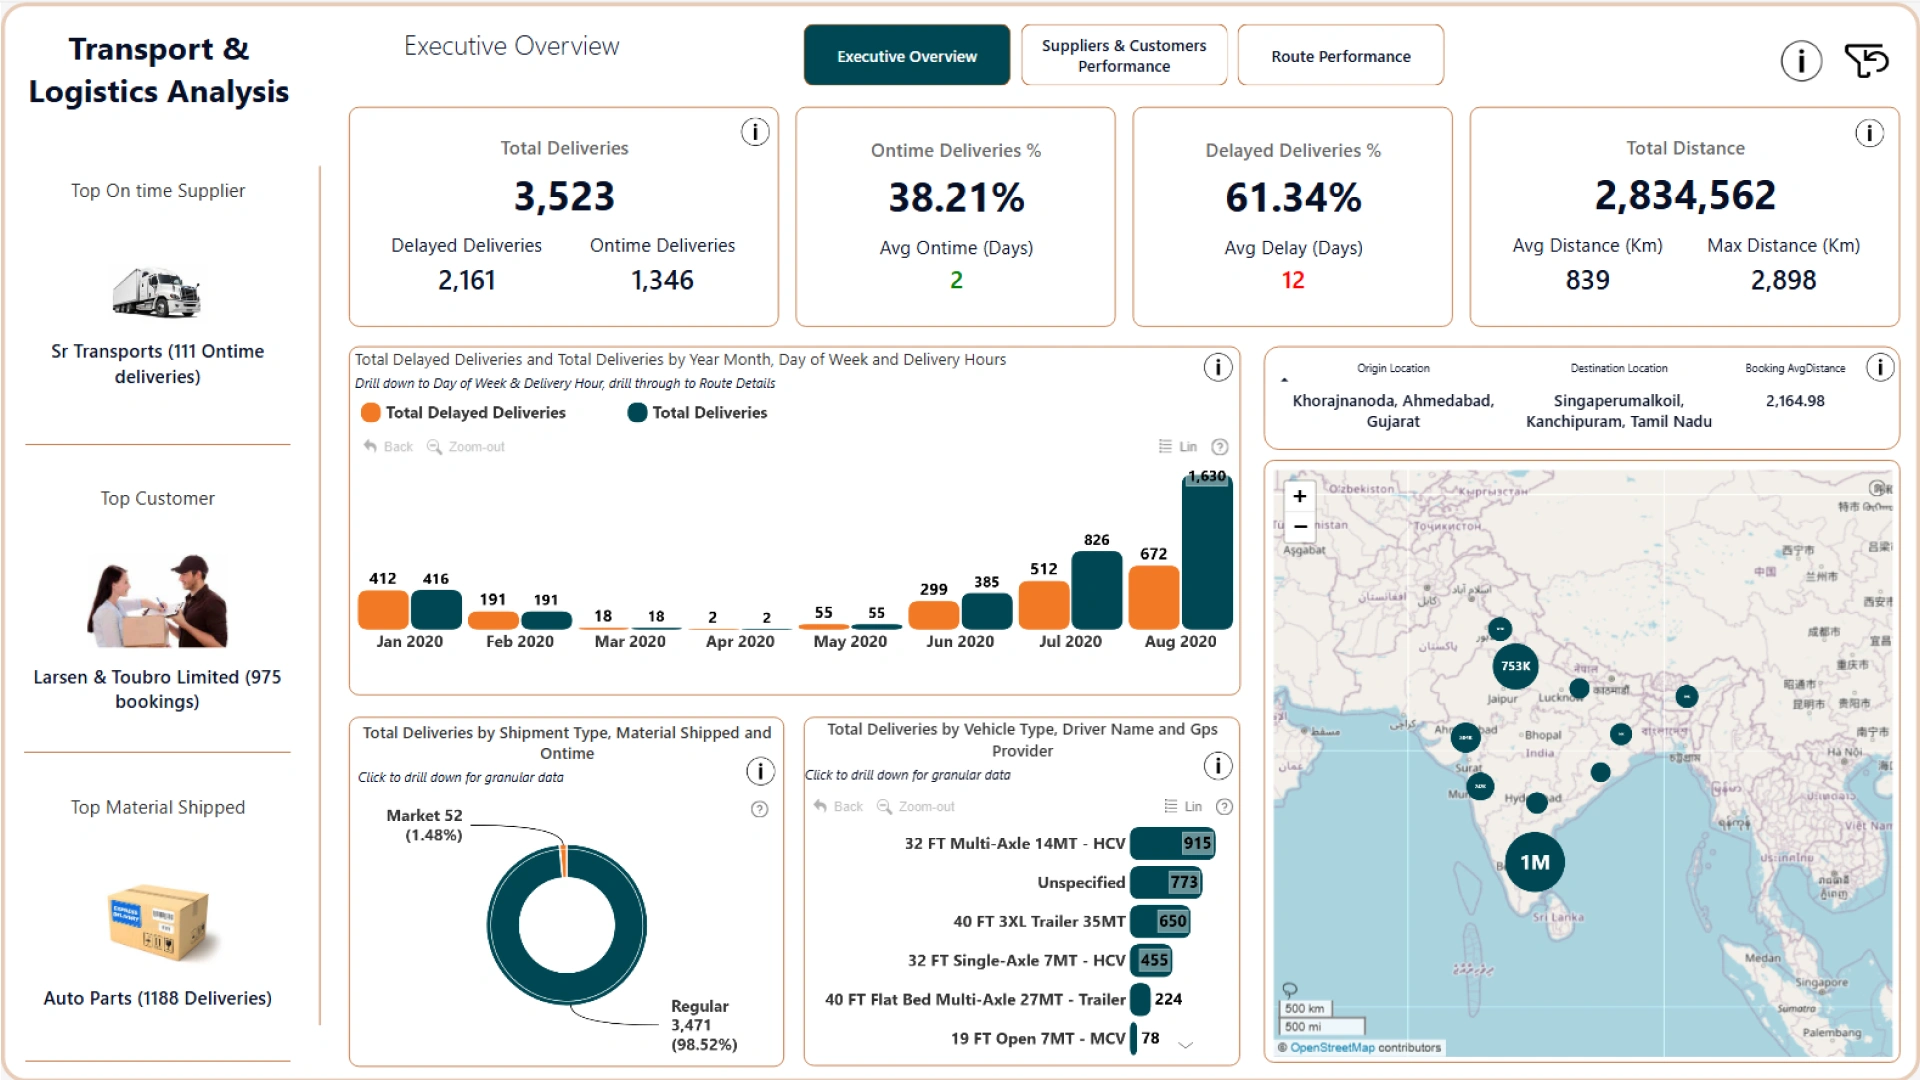
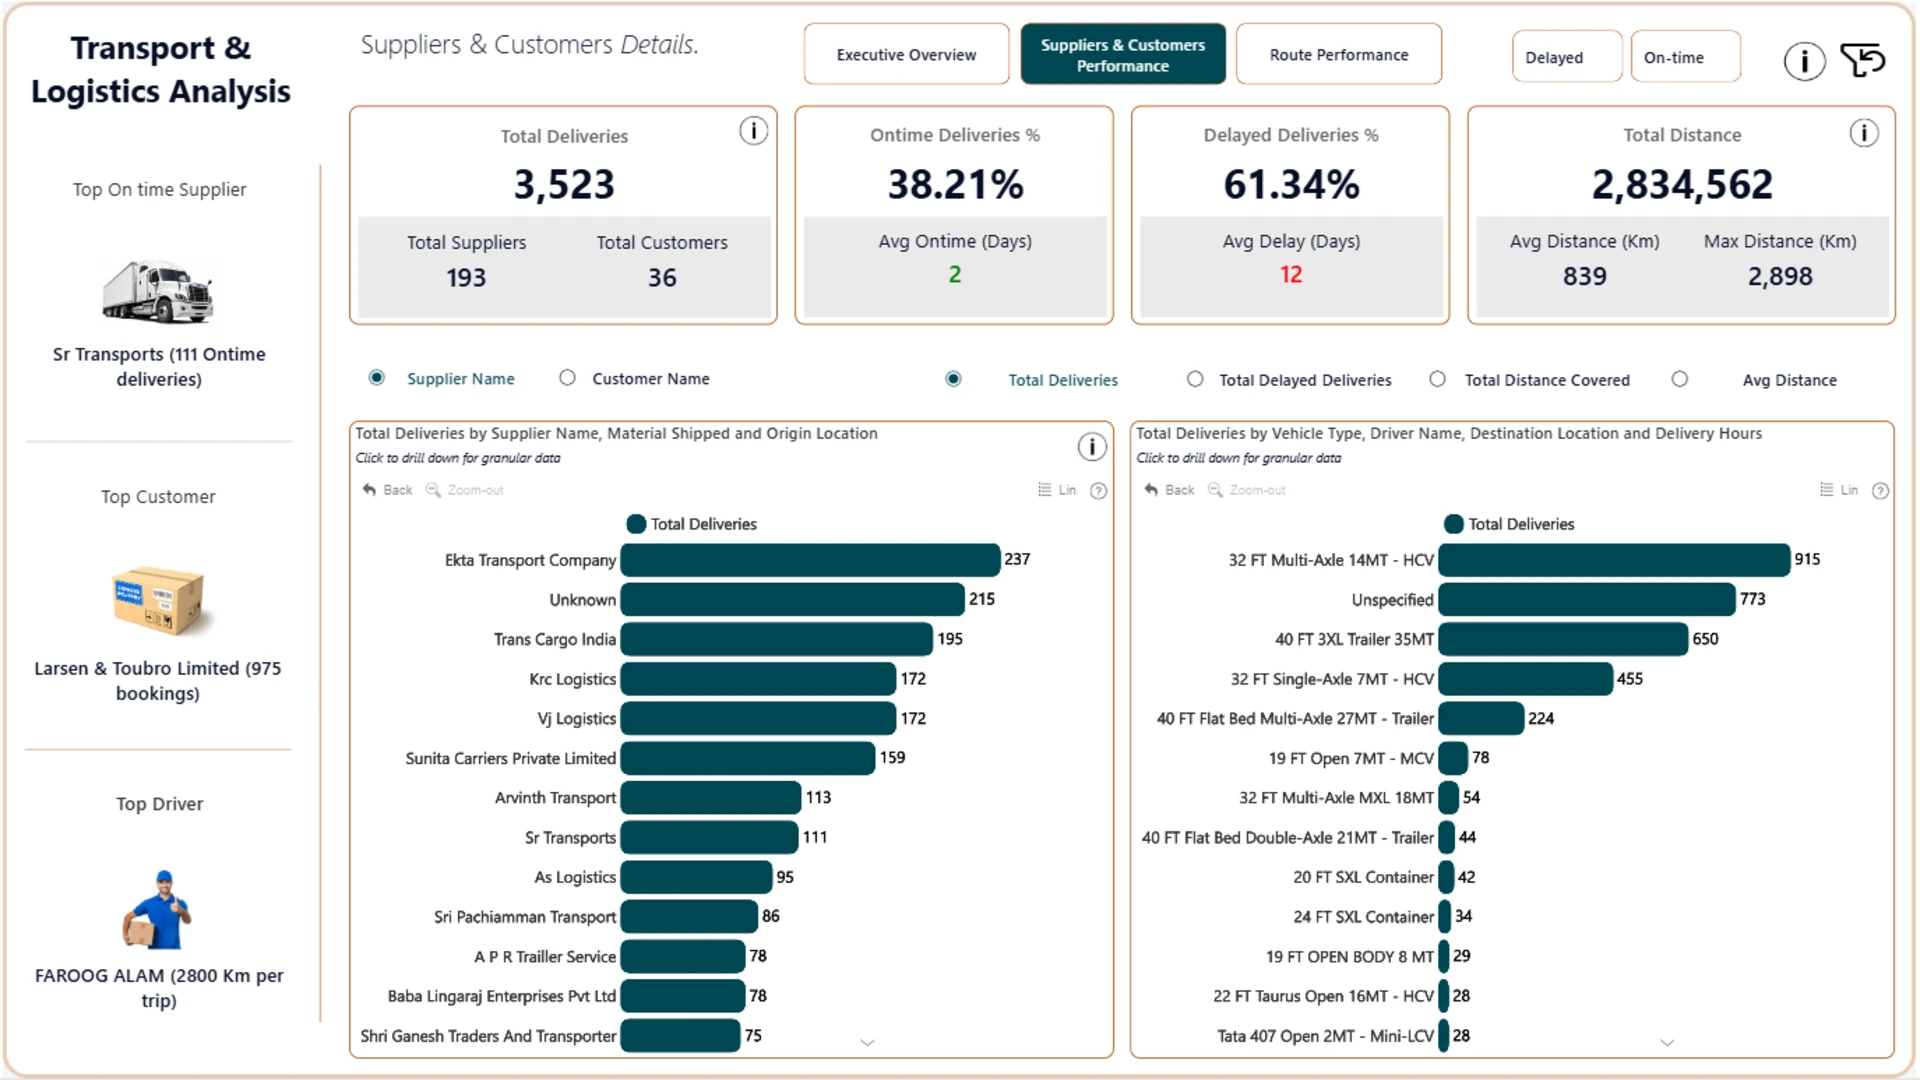
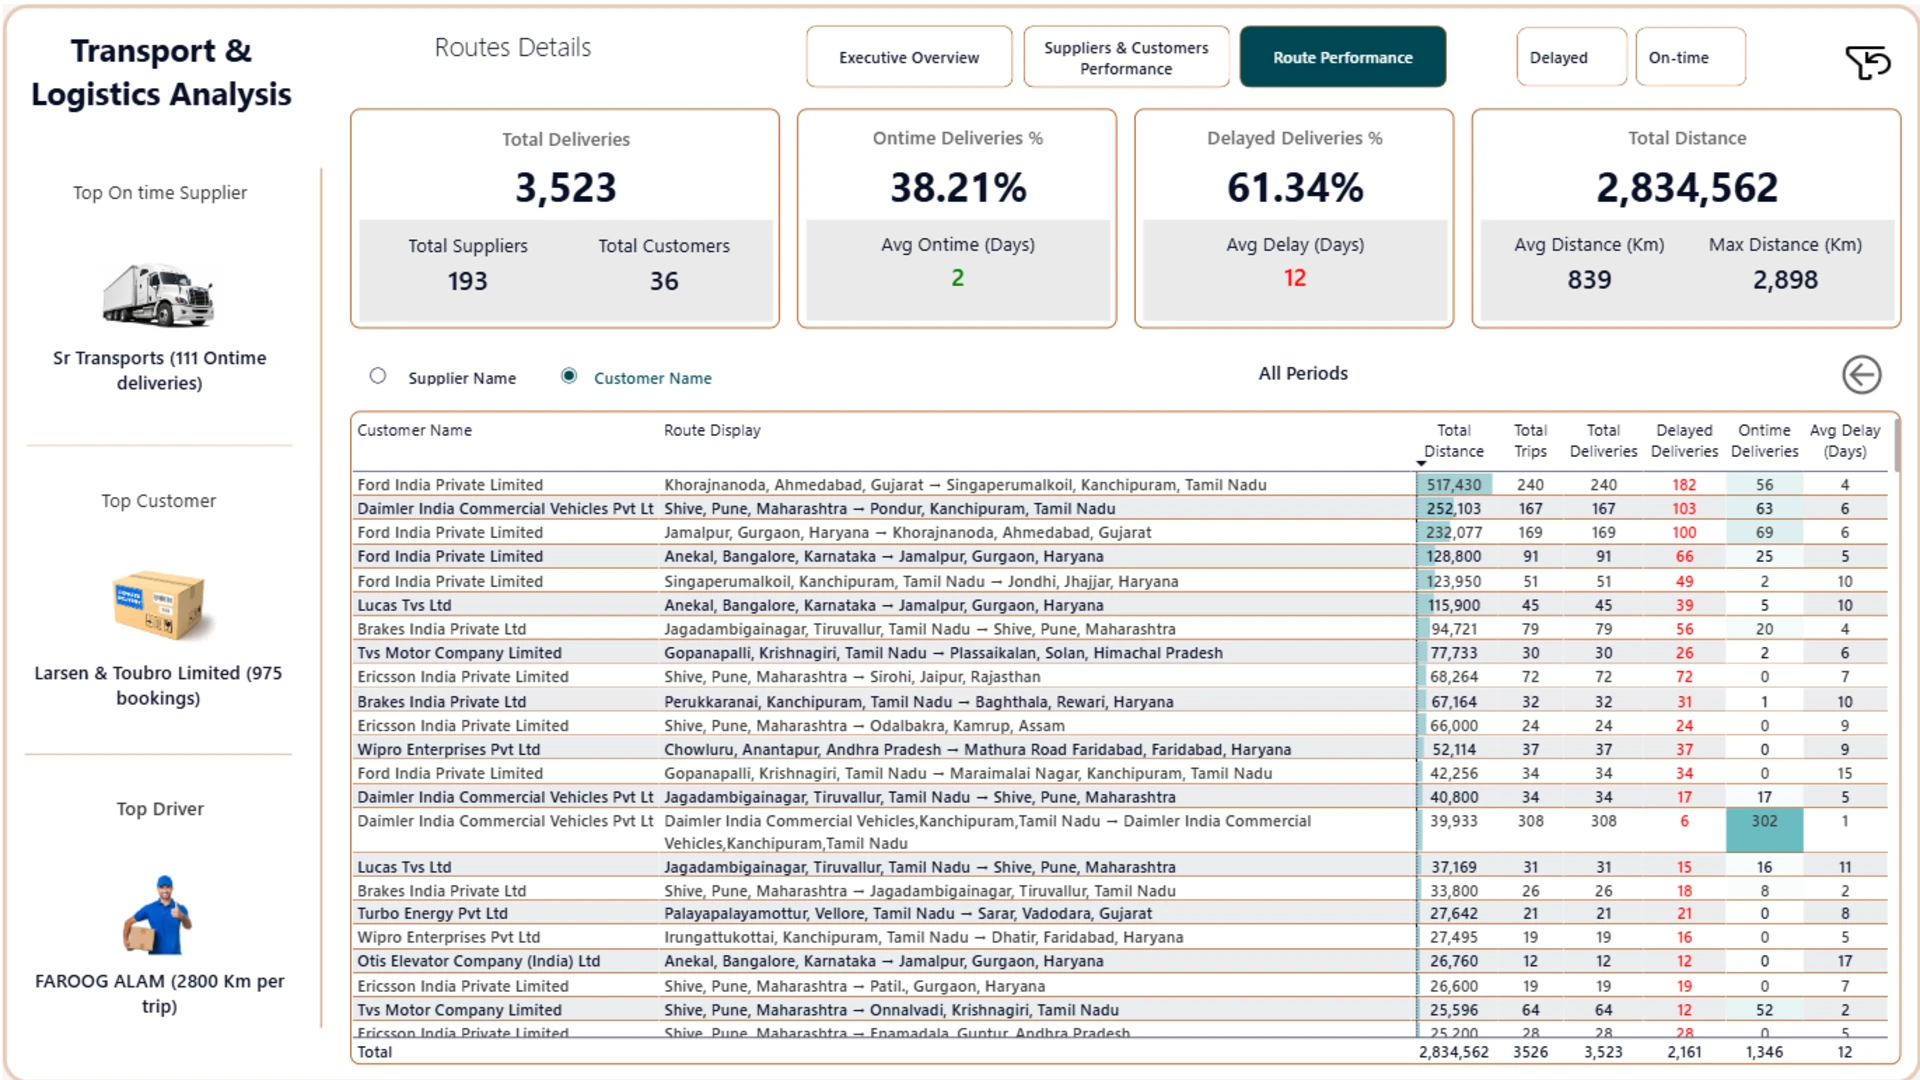
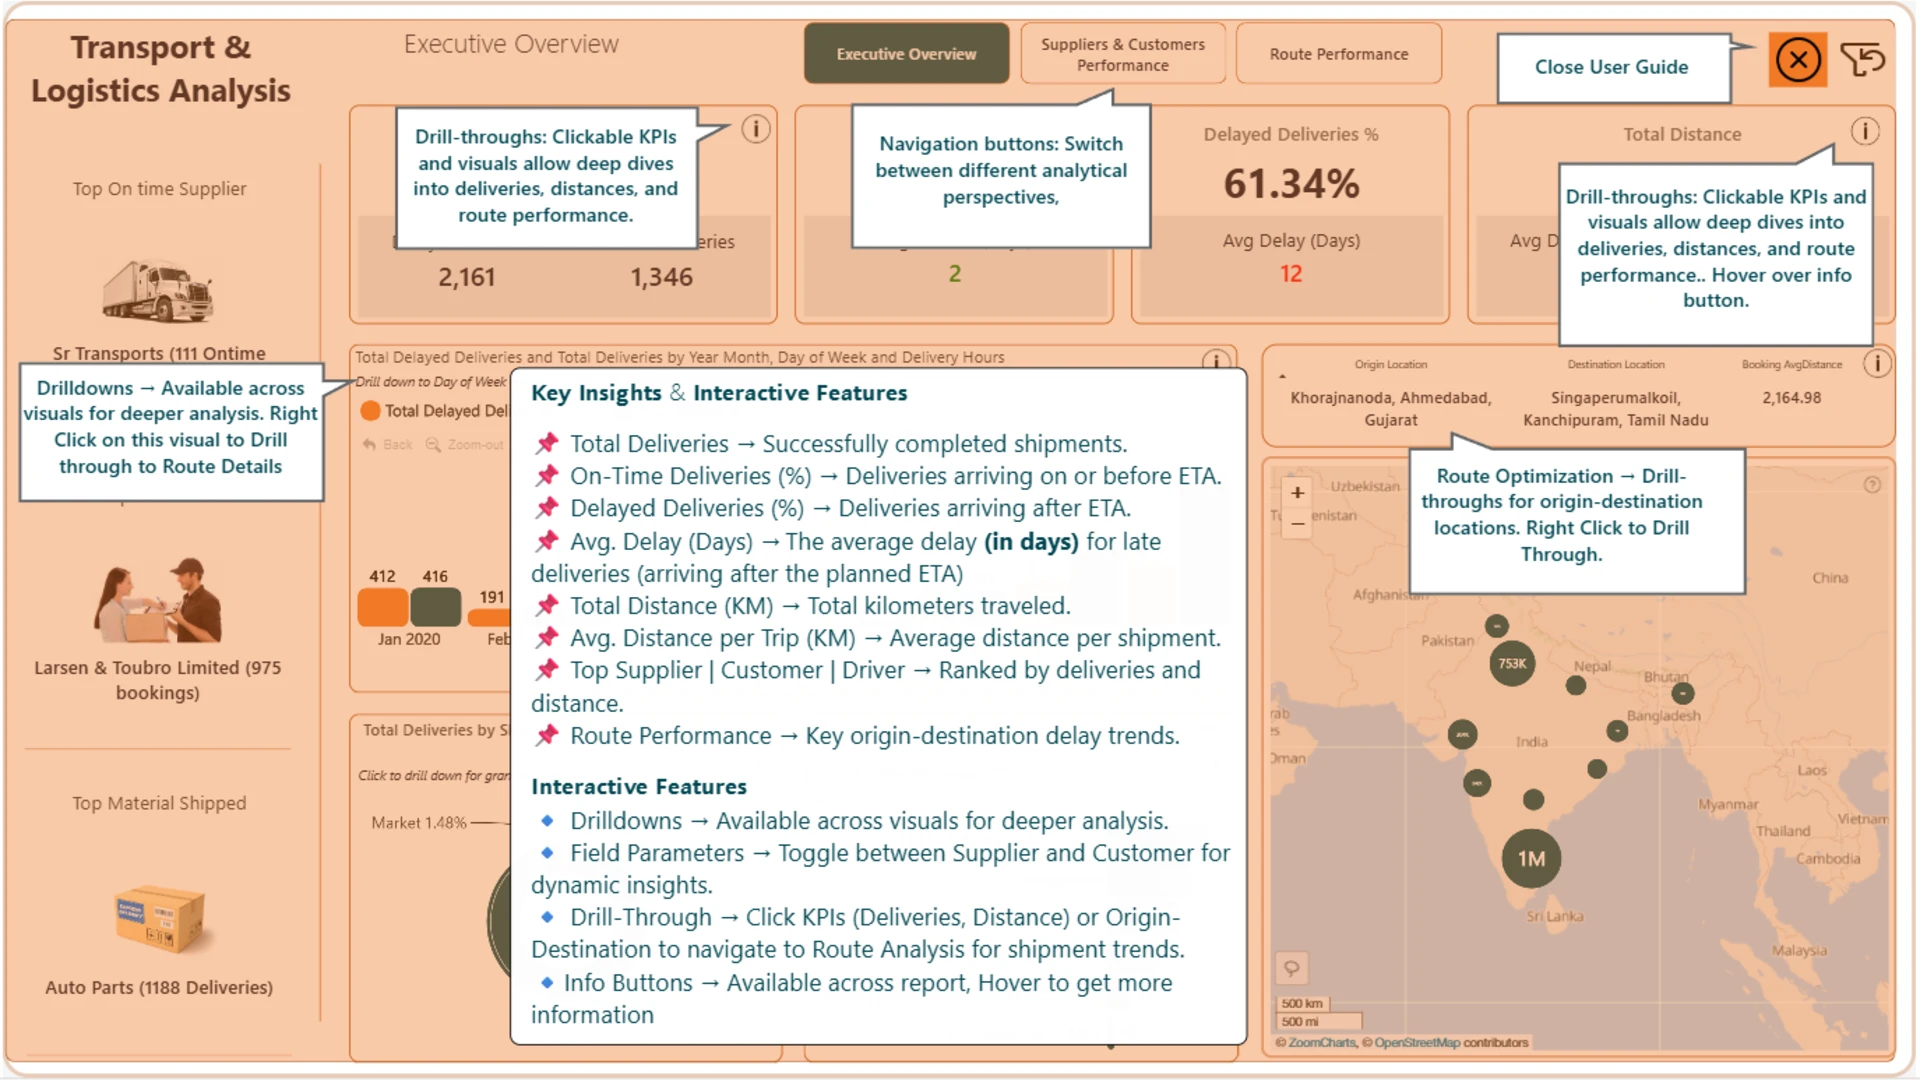
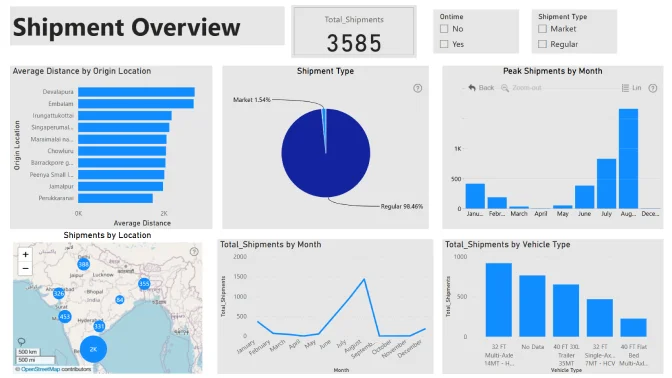
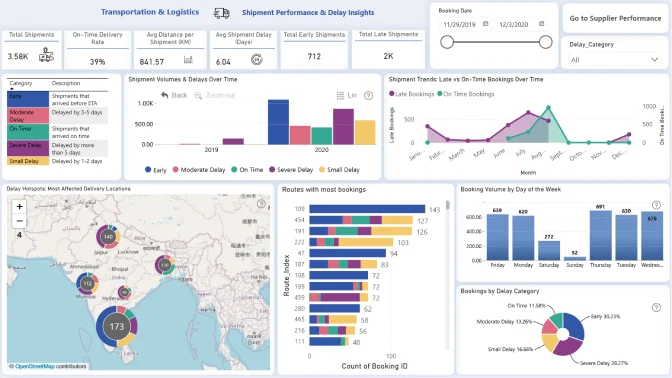
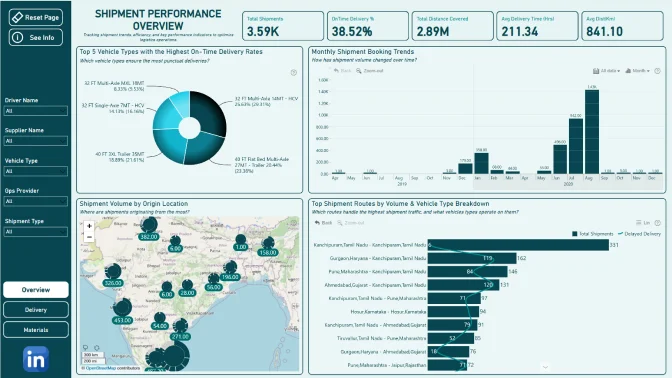
This interactive Power BI dashboard provides a comprehensive analysis of supplier, customer, and route performance using field parameters for dynamic metric selection. Key features include: ✅ Drill-through from KPIs & Visuals – Analyze deliveries, distance, and delays in depth ✅ Trend Analysis – Identify disruptions and recovery patterns over time ✅ Supplier & Customer Insights – Top performers by deliveries and on-time shipments ✅ Route Analysis – Understand delay patterns and performance across locations With interactive drilldowns and customizable views, this report enables data-driven decision-making for logistics optimization.
ZoomCharts visuals used
4U Report Challenges
Participate in data challenges, build and submit reports to get free template downloads.
Join CommunityMobile view allows you to interact with the report. To Download the template please switch to desktop view.
Was this helpful? Thank you for your feedback!
Sorry about that.
How can we improve it?