904
Consumer Financial Complaints Power BI Dashboard Example
Consumer Financial Complaints Power BI Dashboard Example
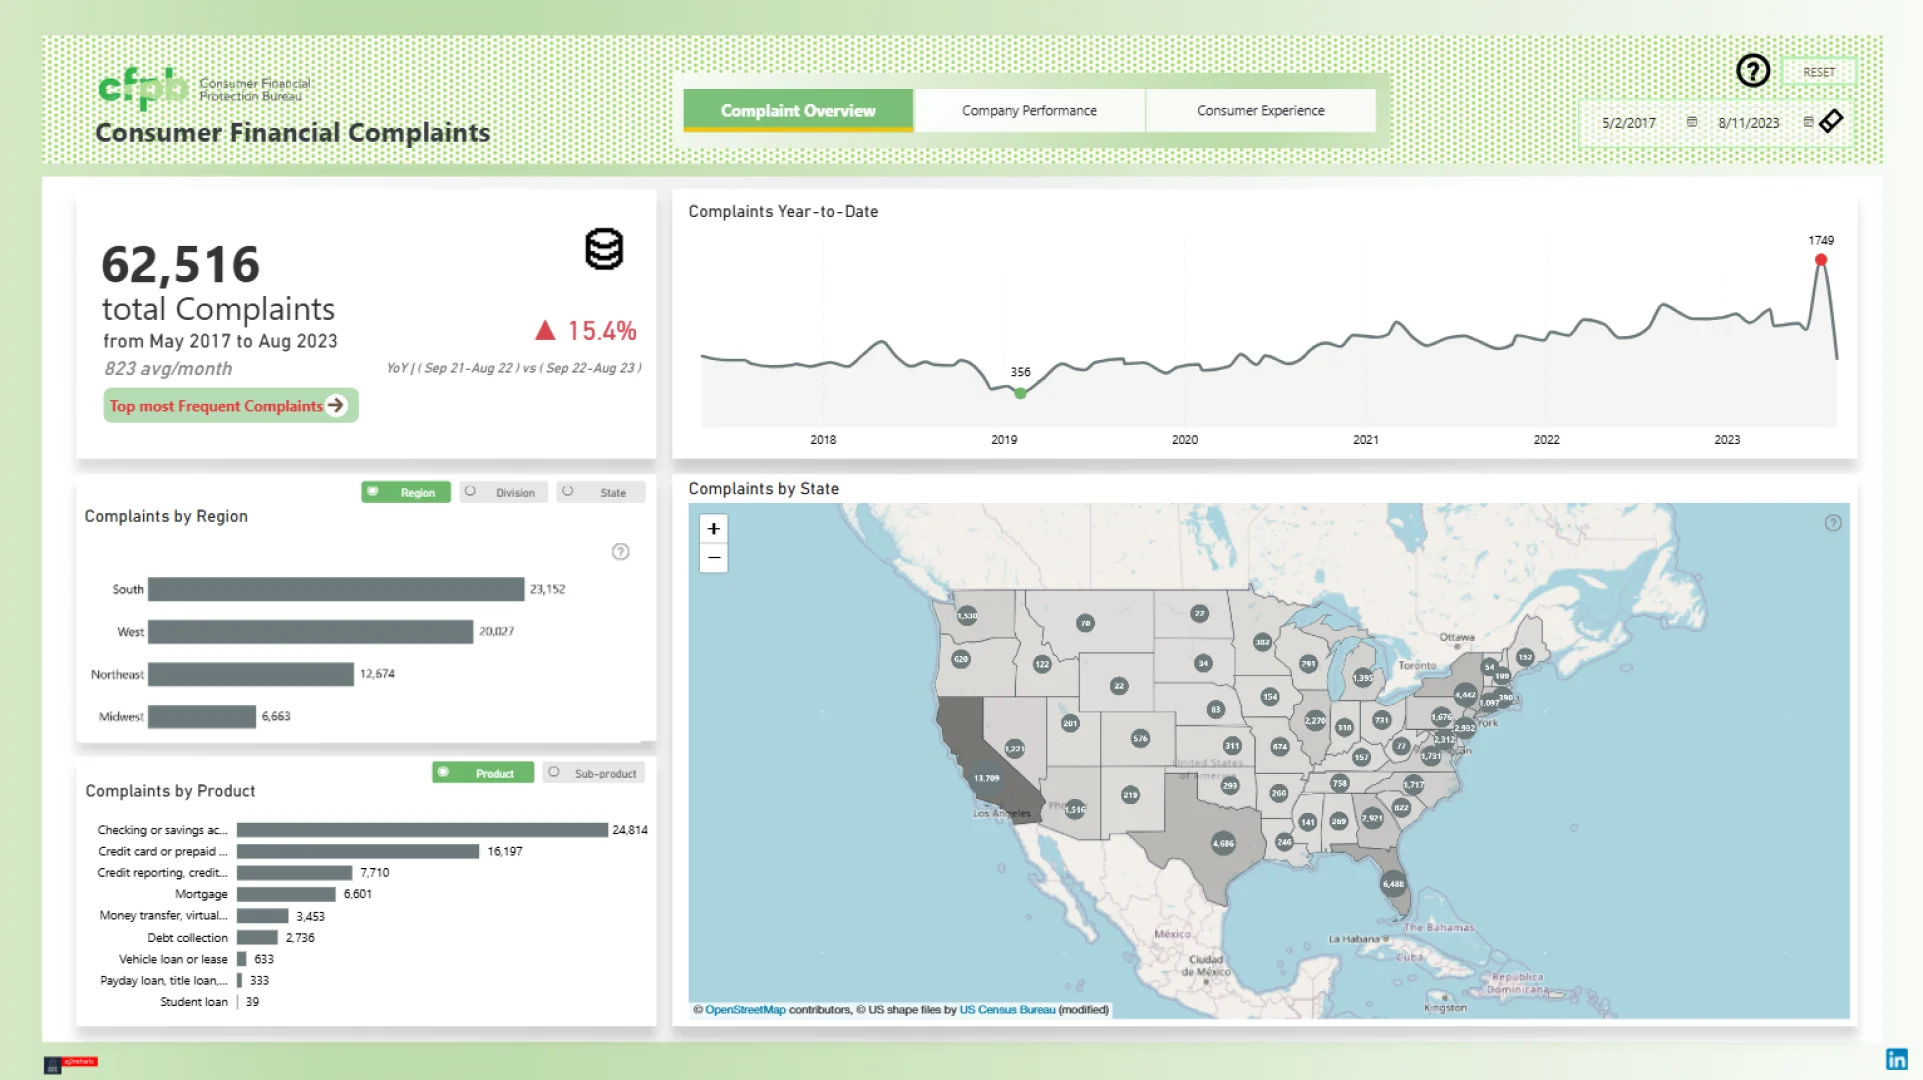
Report Author: Chiemezuo Ngerem
904
Share template with others
Consumer Financial Complaints Power BI Dashboard Example aims to show overall complaint volume, time trends, and geographical hotspots, addressing questions such as: When do complaints rise or fall? Which regions or states are hotspots? Which products and sub-products generate the most complaints? Company Performance focuses on evaluating how companies handled complaints and their responsiveness rank, shows if the company's response rate correlates with the their response time, etc Consumer Experience seeks to reveal which issues and submission channels are most effective, how timely companies react, and how company size influences response effectiveness and consumer outcomes.
This Power BI report uses the Consumer Financial Complaints Dataset and features ZoomCharts Drill Down PRO custom visuals for Power BI. It was submitted to the Onyx Data DataDNA ZoomCharts Mini Challenge in October 2025.
ZoomCharts visuals used





4U Report Challenges
Participate in data challenges, build and submit reports to get free template downloads.
Join CommunityMobile view allows you to interact with the report. To Download the template please switch to desktop view.
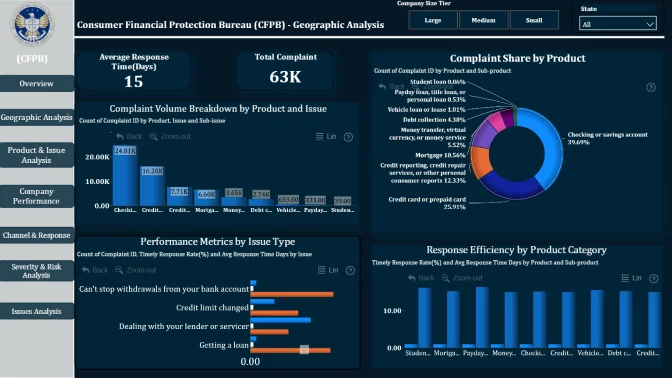
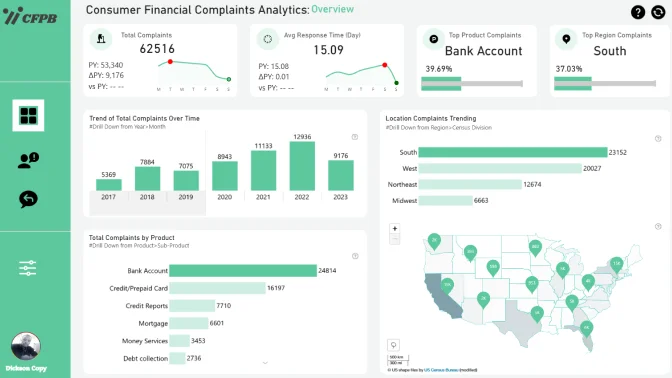
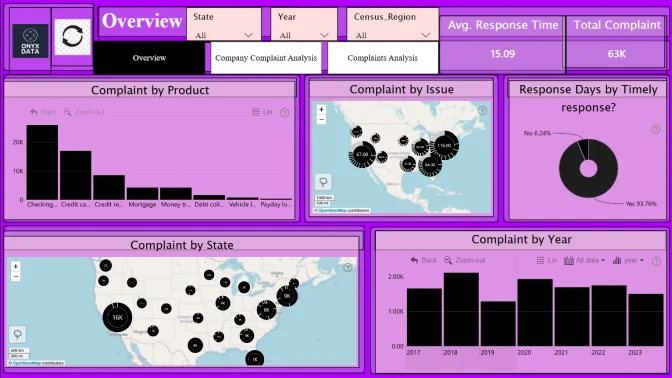
How to use a PBIX template
Preview the interactive report, download the PBIX file, open it in Power BI Desktop, and replace the same data connection with your own dataset.
Preview and download
Explore the report online and download the PBIX template file.
Open in Power BI Desktop
Open the downloaded PBIX file in Power BI Desktop.
Connect your data
Replace the sample data source with your own dataset.
Refresh and adjust
Refresh the model and update fields or visual were needed.
Save and share
Save your report and publish it for your audience.


