logo
For Power BI Report Templates
  • Products

    Drill Down Visuals for Power BI

    Discover the most customizable custom visuals for Power BI.

    Pricing & licensing
    • Drill Down Donut Pro
      Drill Down Donut Category Composition
    • Drill Down Pie Pro
      Drill Down Pie Proportional Breakdown
    • Drill Down Combo Pro
      Drill Down Combo Multi-Metric Trends
    • Drill Down Combo Bar Pro
      Drill Down Combo Bar Cross-Metric Trends
    • Drill Down Line Pro
      Drill Down Line Trend Analysis
    • Drill Down Bubble Pro
      Drill Down Bubble Value Relationships
    • Drill Down Scatter Pro
      Drill Down Scatter Correlation Analysis
    • Drill Down Network Pro
      Drill Down Network Entity Connections
    • Drill Down Graph Pro
      Drill Down Graph Relationship Mapping
    • Drill Down Map Pro
      Drill Down Map Geographic Insights
    • Drill Down Waterfall Pro
      Drill Down Waterfall Change Breakdown
    • Drill Down Timeline Pro
      Drill Down Timeline Time-Based Metrics
    • Drill Down TimeSeries Pro
      Drill Down TimeSeries Temporal Patterns
    • Drill Down Line Pro
      Drill Down Line Trend Analysis

    Visuals in Planning

    Discover visuals we’re exploring, share your feedback, and help us decide what to build next.

    Browse concepts
  • Report Templates
    • Browse Report Templates
      Browse Report Templates Explore 2700+
      Power BI reports
    • Plans & Pricing Choose the report download plan
      that fits your needs

    Browse by Category

    KPISalesProject ManagementFinanceLogisticsBankingHRCRMMarketingCustomer Support
  • Resources

      Learn

    • Video Tutorials Step-by-step Power BI guides
    • Webinars Live and recorded expert sessions
    • Visuals Gallery Explore all custom Power BI visuals
    • Blog Power BI tips, updates, and guides
    • Documentation Setup, features, and API reference

    Support

    • ZoomCharts Assistance Help from our product experts
    • Contact Sales Questions about pricing or licensing
    • Contact Support Technical help and troubleshooting
    • FAQ Quick answers to common questions
  • Services
    • Power BI Report Development
      Power BI Report Development End-to-end custom
      Power BI reports.
    • Custom Visual Development
      Custom Visual Development Custom visuals for
      your business needs.
  • Challenges
  • Pricing
Request a quote Try Free Trial Sign in
Request a quote Book a Demo Try Free Trial Sign in
Get it now
Go back

Contents

Reset your password

We'll email you instructions on how to reset your password

Go back

Share

Logo

How to Build a Recruitment Dashboard in Power BI

Nov 02 - Nov 30, 2026 | EST

Pre-registration for the most popular Power BI challenge in the data analytics community! Build reports, earn your professional credibility, and win amazing prizes.

Submission deadline

00

DAYS

00

HOURS

00

MINUTES

00

SECONDS

Register Now

Make sure you provide an email address that you check regularly.


Already have an account? Sign in!

Login options
Forgot password?

Register for the challenge


Activate free ZoomCharts license

Get ZoomCharts Developer License Select this option if you already have a Microsoft work or school account to activate and use ZoomCharts visuals in Power BI Desktop.

Activate your free developer license to use Drill Down visuals in your challenge report.

Activate License

Create a free
Microsoft account To install ZoomCharts visuals from the Power BI marketplace, you need a Microsoft account.

Don’t have a Microsoft account yet? Create a free account to build reports and join challenges.

Activate Account

Challenge Dataset

Get the dataset

Ready to submit?

Thank you! Your report has been submitted!

View report

Submitted:

Your report will undergo validation. Once the validation of your report is complete, we will send you a Power BI Publish to Web link that you can share publicly.

Confirmed your submission fits the criteria:

Reviewed:

Rejection reason:

Sorry, we are no longer accepting entries for this competition. Stay tuned for future events!

Something went wrong, please contact support!

Timeline

Registration Open

Registration Open

02 November | 10:00

-

Submissions Open

Submissions Open

02 November | 10:00

-

Workshop | How to Build a Power BI Recruitment Analytics Dashboard

Workshop | How to Build a Power BI Recruitment Analytics Dashboard

13 November | 07:00

-

1:1 Mentoring Sessions

1:1 Mentoring Sessions

13 November | 07:00

02 November - 25 November

Entry Submission Deadline

Entry Submission Deadline

25 November | 16:59

02 November - 25 November

Winner Announced

Winner Announced

30 November | 10:00

02 November - 25 November

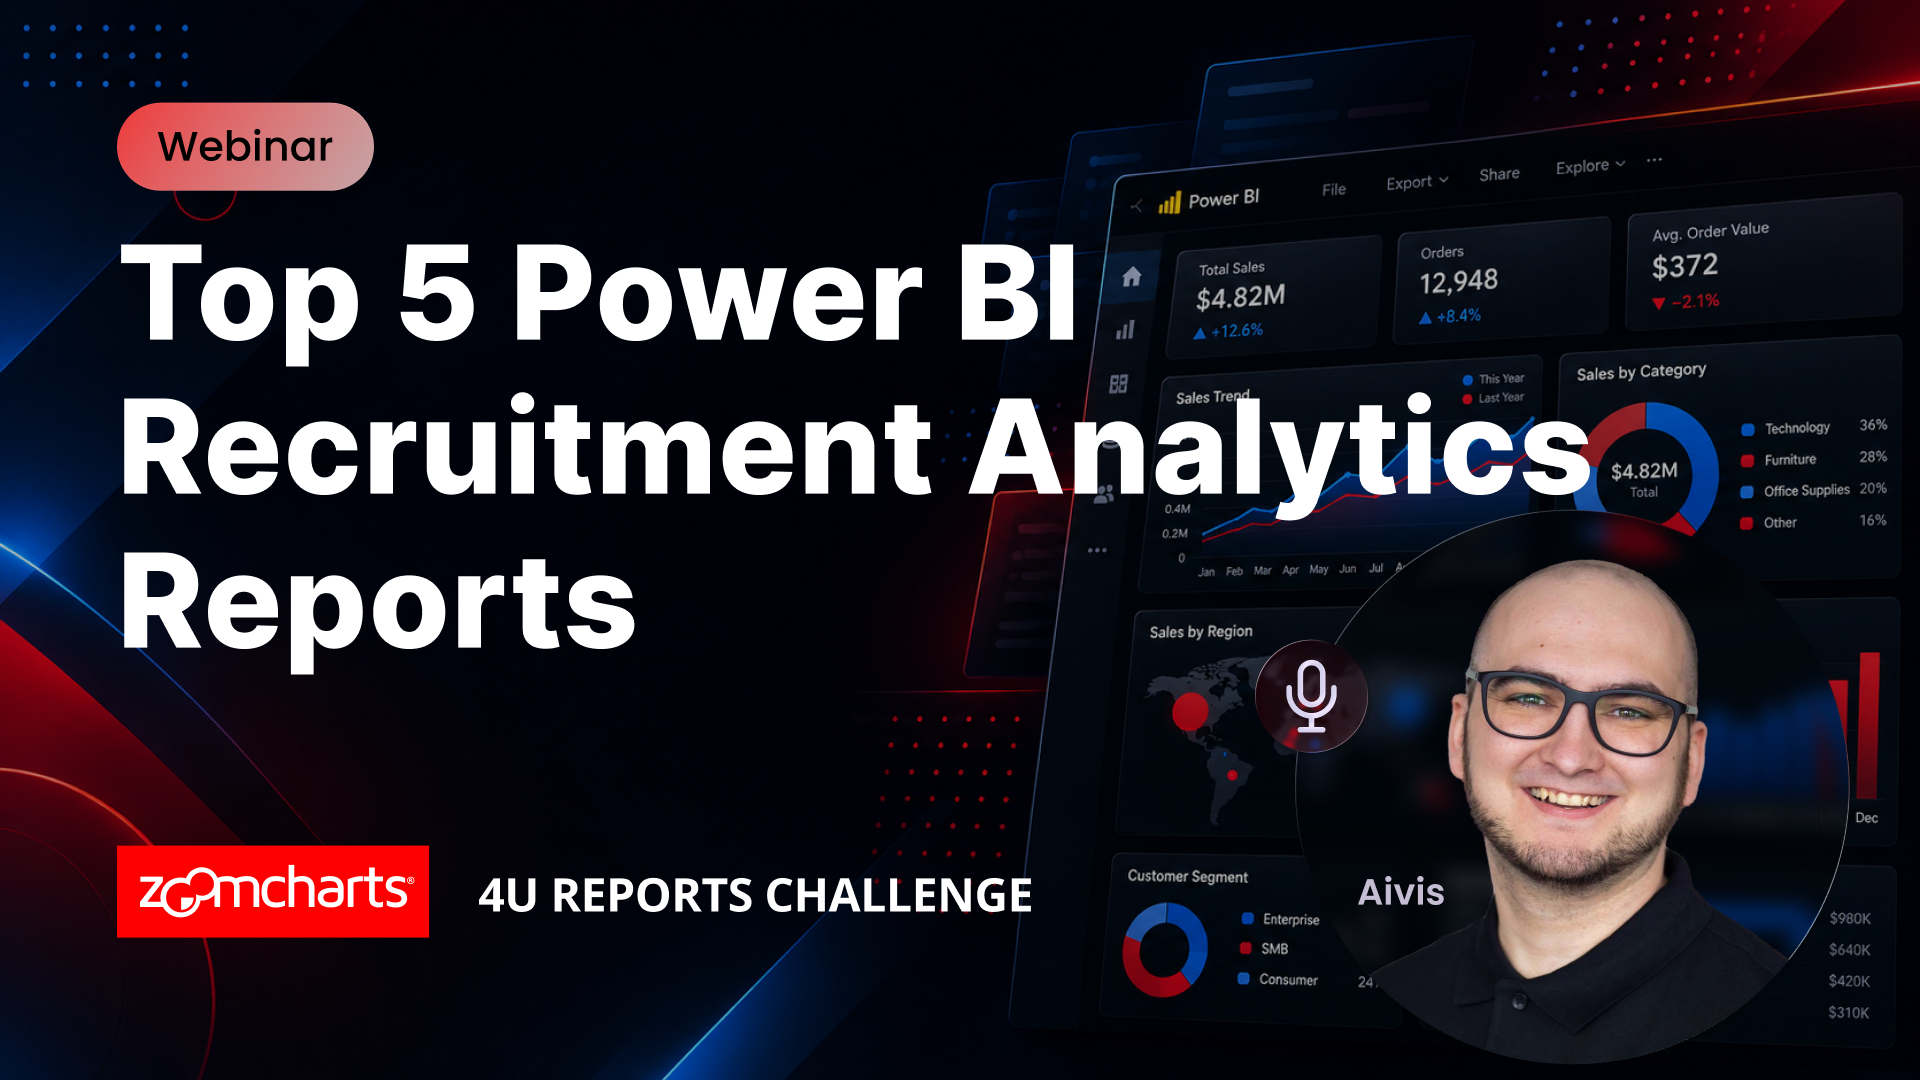
Webinar | Top 5 Power BI Recruitment Analytics Reports

Webinar | Top 5 Power BI Recruitment Analytics Reports

30 November | 11:00

02 November - 25 November

Dataset

Get the dataset

Share the challenge

About Challenge
How to Participate
The Brief
Judging Criteria
Timeline
Dataset
My licenses
Mentoring

About the 4U Reports Challenge

Build your Power BI skills, grow your portfolio, and compete for prizes.

Each month, explore a new business dataset and turn it into an interactive Power BI report. Get expert guidance, receive personal feedback, and share your work with a community of 20,000+ BI professionals.

Your goal is to create a 4U Report that is Unique, User-friendly, Uncovering, and Understandable.

Main Prizes

The creators of the three best overall reports receive Amazon gift cards.

1st Place

$300

Amazon gift card

2nd Place

$200

Amazon gift card

3rd Place

$100

Amazon gift card

Learn with Expert Support

Get guidance throughout the challenge to improve your report-building skills.

Live Power BI Workshop

Learn report-building best practices in the Power BI Recruitment Analytics workshop .

1:1 Mentoring

Review your report with an experienced Power BI professional and receive advice tailored to your questions.

Personal Report Feedback

Receive detailed feedback on your submitted report to understand what works well and where you can improve.

Free Resources for Participants

Access the tools and resources you need to build your report.

ZoomCharts Developer License

Get access to the full Drill Down PRO visuals library to build your challenge report.

Microsoft Account, If Needed

Don't have a Microsoft work or school account? ZoomCharts can provide one for challenge participation.

5 Free Report Downloads

Receive five downloads from the Power BI Report Gallery once your submitted report is validated.

Additional Rewards & Recognition

Great reports deserve recognition beyond the main prizes.

+10

Free Report Downloads

Creators of the Top 5 reports receive 10 additional downloads from the Power BI Report Gallery.

Top 5

Official Certificates

ZoomCharts certificates recognize the Top 5 reports, honorable mentions, and most-liked reports.

Top 5 & Winners Webinar

Winners Announced on November 30

Join our live webinar to explore the five best recruitment analytics reports, discover what makes them stand out, and find out who wins.

Webinars

Learn more about ZoomCharts visuals & gain a knowledge advantage in the contest by joining the upcoming webinars! You'll also get the chance to your ask questions and get expert answers in the Q&A section.

Upcoming webinars

Recording thumbnail

Top 5 Power BI Recruitment Analytics Reports

30th November, 2026

11:00 AM - EST

See how the strongest challenge submissions transformed recruitment campaign data into interactive Power BI reports for evaluating channel efficiency and lasting hire value.

Learn more

Past Webinar recordings

Recording thumbnail

How to Build a Power BI Recruitment Analytics Dashboard

See how the strongest challenge submissions transformed recruitment campaign data into interactive Power BI reports for evaluating channel efficiency and lasting hire value.

Watch the recording

How to participate in the challenge

Follow these steps to register, build your Power BI report, submit your entry, and compete for prizes.

1

Register for the Challenge

  • Register using the form above.
  • Download the challenge dataset using the "Get the Dataset" button.
  • Activate your free ZoomCharts Drill Down PRO Visuals License for Power BI:

    - If you have your own Microsoft account, select "See My License" and follow the setup video to add your ZoomCharts license to Power BI Desktop.
    - If you don’t have a work or school Microsoft account, select "See My Account" to activate a free Microsoft account provided by ZoomCharts exclusively for challenge participants (read account activation instructions).
2

Build Your Report in Power BI

  • Add ZoomCharts visuals from the Power BI visuals library or Microsoft Marketplace.
  • Add your ZoomCharts license to Power BI Desktop.
  • Build your Power BI report using the challenge dataset; explore requirements in 'The Brief' section.
  • Your report must include at least 3 (three) ZoomCharts Drill Down Visuals on at least 1 report page.
3

Improve Your Report and Learn

  • Join the challenge workshop to learn how to use ZoomCharts visuals and the dataset.
  • If you need help, book a free consultation with the ZoomCharts team.
  • Browse the Template Gallery for inspiration and ideas.
4

Submit Your Challenge Entry

Upload your report in .pbix format using the submission form on this page.

If your report does not meet the challenge requirements:

You will receive an email explaining what needs to be fixed. You can update your report and submit it again.

Validation timeline:

  1. Your report will be reviewed within 1-2 business days.
  2. Once validated, you will receive a Publish to Web link you can share publicly or add to your portfolio.
  3. You will also receive personalized feedback from the evaluation team within 1-2 business days.
  4. Use this feedback to improve your report and resubmit before the deadline.

Note: You can resubmit your entry as many times as needed before the final deadline.

5

Finalize Your Participation to Compete for Prizes

  • Share a LinkedIn post showing your finished report as an image, screenshot, or video.
  • Tag @ZoomCharts and use the hashtags #4UReport and #builtwithzoomcharts.
  • Follow ZoomCharts LinkedIn page.
6

Attend the Live Closing Webinar

The ZoomCharts team reviews and analyzes the Top 5 Challenge entries during the live webinar. You will learn best practices, improvement tips, and see how others solved the challenge. Winners will be announced during the live webinar and afterward on the ZoomCharts LinkedIn page.

Report Requirements

Tool

Power BI

Report length

Up to 3 pages

Including drill-through pages

Canvas size

16:9 or 1920 × 1080

ZoomCharts visuals

Minimum 3 visuals

On one report page

See the Drill Down PRO Visuals Cheat Sheet for available ZoomCharts visuals.

Power BI Recruitment Dashboard Challenge

Create an interactive Power BI report that helps Talent Acquisition leaders, HR teams, Finance partners, and hiring managers evaluate recruitment channels, hiring costs, and long-term employee outcomes.

The central challenge

Which recruitment channels deliver suitable hires at a reasonable acquisition cost, and which continue to provide value after probation, retention, and performance are considered?

Go beyond simple hiring volume and cost-per-hire rankings. Explore how recruitment channel performance changes across departments, role families, seniority levels, countries, providers, and time periods.

Key Questions to Explore

01. Recruitment Spend & Cost

  • Where is recruitment spending concentrated?
  • How do advertising costs, agency fees, referral bonuses, and internal recruitment costs affect overall efficiency?

02. Candidate Quality & Funnel

  • Which channels generate qualified candidates rather than applicant volume alone?
  • Where does the recruitment funnel lose candidates?

03. Hiring Efficiency

  • Which channels and providers fill roles efficiently?
  • Where could a different sourcing or provider mix be worth investigating?

04. Long-Term Hiring Value

  • Which hires pass probation, remain employed for 180 days, and meet performance expectations?
  • Does an inexpensive channel remain cost-effective after unsuccessful outcomes are considered?

What makes a strong submission?

Build a report tailored to real recruitment decisions: user-friendly to explore, capable of uncovering meaningful differences, and clear enough for stakeholders to understand and act on.

Judging Criteria

Each submission is evaluated based on four main criteria: Inspiring, Intuitive, Interactive, and Insightful. These dimensions ensure that the solution is visually compelling, easy to understand, engaging to use, and capable of delivering valuable insights.

Inspiring

Max 15 pts

How visually clear, modern, and purposeful the report looks.

  • Visually Appealing Design: Is the design harmonious, with a modern color palette, consistent formatting, and a clear presentation of information?
  • Clear and Focused Visualizations: Are only the necessary visualizations used, avoiding clutter and keeping focus on key insights?
  • Readability: Are color contrasts appropriate and text elements easy to read across different devices and screen sizes?

Intuitive

Max 15 pts

How clear and easy it is to understand the report at a glance.

  • Logical Navigation: Is the report organized with intuitive navigation paths, reset options, and a structure that allows users to explore at their own pace?
  • Storytelling through Data: Does the report present data in a logical and compelling narrative that supports decision-making?
  • Streamlined Information: Is the report focused on key data without overwhelming the user with unnecessary details?
  • Tooltips and Labeling: Are tooltips, titles, and legends clear, helpful, and supportive of understanding without cluttering the design?

Interactive

Max 15 pts

How engaging and seamless the report exploration and interaction with data feels.

  • Dynamic User Controls: Are slicers and interactive elements designed so users can easily adjust and explore different data views?
  • Cross-Chart Integration: Are charts connected in a way that filtering and interactions feel smooth and unified across the report?
  • Drill-Down Functionality: Can users intuitively dive deeper into data layers to explore additional details and insights?
  • Guided Learning Aids: Are there helpful tutorials, hints, or onboarding elements that support users in understanding and navigating the report?

Insightful

Max 15 pts

How accurate, complete, and meaningful the data is in driving decisions.

  • Depth of Analysis: Does the analysis provide meaningful insights and fully address the problem using effective methods?
  • Data Accuracy: Is the data consistent across visuals, and are calculations and aggregations applied correctly?
  • Performance Optimization: Is the report optimized for fast loading and smooth performance, even with larger datasets?
  • Data Cleanliness: Is the data well-prepared, free from redundancies or gaps, and structured to support reliable analysis?

Timeline

Registration Open

Registration Open

02 November | 10:00

-

Submissions Open

Submissions Open

02 November | 10:00

-

Workshop | How to Build a Power BI Recruitment Analytics Dashboard

Workshop | How to Build a Power BI Recruitment Analytics Dashboard

13 November | 07:00

-

1:1 Mentoring Sessions

1:1 Mentoring Sessions

13 November | 07:00

02 November - 25 November

Entry Submission Deadline

Entry Submission Deadline

25 November | 16:59

02 November - 25 November

Winner Announced

Winner Announced

30 November | 10:00

02 November - 25 November

Webinar | Top 5 Power BI Recruitment Analytics Reports

Webinar | Top 5 Power BI Recruitment Analytics Reports

30 November | 11:00

02 November - 25 November

Dataset

Get the dataset

My licenses

See My Licenses

1:1 mentoring sessions

You can book a personal session with Senior Product Expert at ZoomCharts, Aivis Pavlovs, to gain practical knowledge about Drill Down Visuals and how they can be used to enhance data storytelling in a report.

Book a meeting

Submit your Power BI report to the ZoomCharts 4U Reports Challenge!

Enter your submission by attaching the Power BI report file. Your report will be published on the web, and within 1–2 business days, we’ll email you a link to your report that you can share publicly.

Upload failed
Attach file
Attach dataset file (if changed from original)
File requirements:

Report file allowed types: .pbix

Dataset file allowed types: .csv, .xlsx, .xls

If you are experiencing trouble with uploading your report, please send it in .pbix format along with all required information to [email protected]


Are you sure you want to delete the report?

Invalid email address

Unfortunately, we couldn't reach the email address linked to this profile "". If you wish to receive news, feedback, and the Publish to Web link for your contest submissions, you'll need to create a new ZoomCharts account with a valid email address, or log into an existing account.

Switch account

Get ZoomCharts Developer License Select this option if you already have a Microsoft work or school account to activate and use ZoomCharts visuals in Power BI Desktop.

Activate your free developer license to use Drill Down visuals in your challenge report.


Create a free Microsoft account To install ZoomCharts visuals from the Power BI marketplace, you need a Microsoft account.

Don’t have a Microsoft account yet? Create a free account to build reports and join challenges.


logo
[email protected]
+44 204 577 3993
logo

Products

Drill Down Bubble PRO Drill Down Line PRO Drill Down Network PRO Drill Down Waterfall PRO Drill Down Graph PRO Drill Down Combo PRO Drill Down Combo Bar PRO Drill Down Donut PRO Drill Down Pie PRO Drill Down TimeSeries PRO Drill Down Timeline PRO Drill Down Map PRO Drill Down Scatter PRO All Visuals

Resources

Report Examples Webinars Blog ZoomCharts Academy Visuals Gallery Documentation Subscribe to News

Solutions

Custom Visual Development Power BI Report Development

Company

Pricing About Us Partners Leave feedback Join PowerGroup EU Funding

Help

ZoomCharts Assistance Contact Sales Contact Support FAQ AI Information

Drill Down Line PRO Drill Down Bubble PRO Drill Down Network PRO Drill Down Waterfall PRO Drill Down Graph PRO Drill Down Combo PRO Drill Down Combo Bar PRO Drill Down Donut PRO Drill Down Pie PRO Drill Down TimeSeries PRO Drill Down Timeline PRO Drill Down Map PRO Drill Down Scatter PRO All Visuals

Report Examples Webinars Blog ZoomCharts Academy Visuals Gallery Documentation Subscribe to News

Custom Visual Development Power BI Report Development

Pricing About Us Partners Leave feedback Join PowerGroup EU Funding

ZoomCharts Assistance Contact Sales Contact Support FAQ AI Information
+44 204 577 3993
[email protected]

Ready to get in touch?

Contact our experts with any question about Power BI and ZoomCharts for Free!

Contact us

© 2026, Data Visualization Software Lab

U.S. Patents No. 11,645,343; 11,921,804; 12,346,389

Cookies
Privacy Policy
Global
Legal
Patent
warning

Error message

success

Success info: Done!

ZoomCharts AI Assistant

We noticed you're using an old OS version.

For the best experience, we recommend upgrading to ensure that all website features display correctly.

Cookie settings

We use necessary cookies for site functionality, as well as statistic, marketing, and preference cookies to enhance your experience. For more information and to manage your preferences, please visit our Cookie policy
