Feel free to leave your vote:
0
Share template with others
Summary
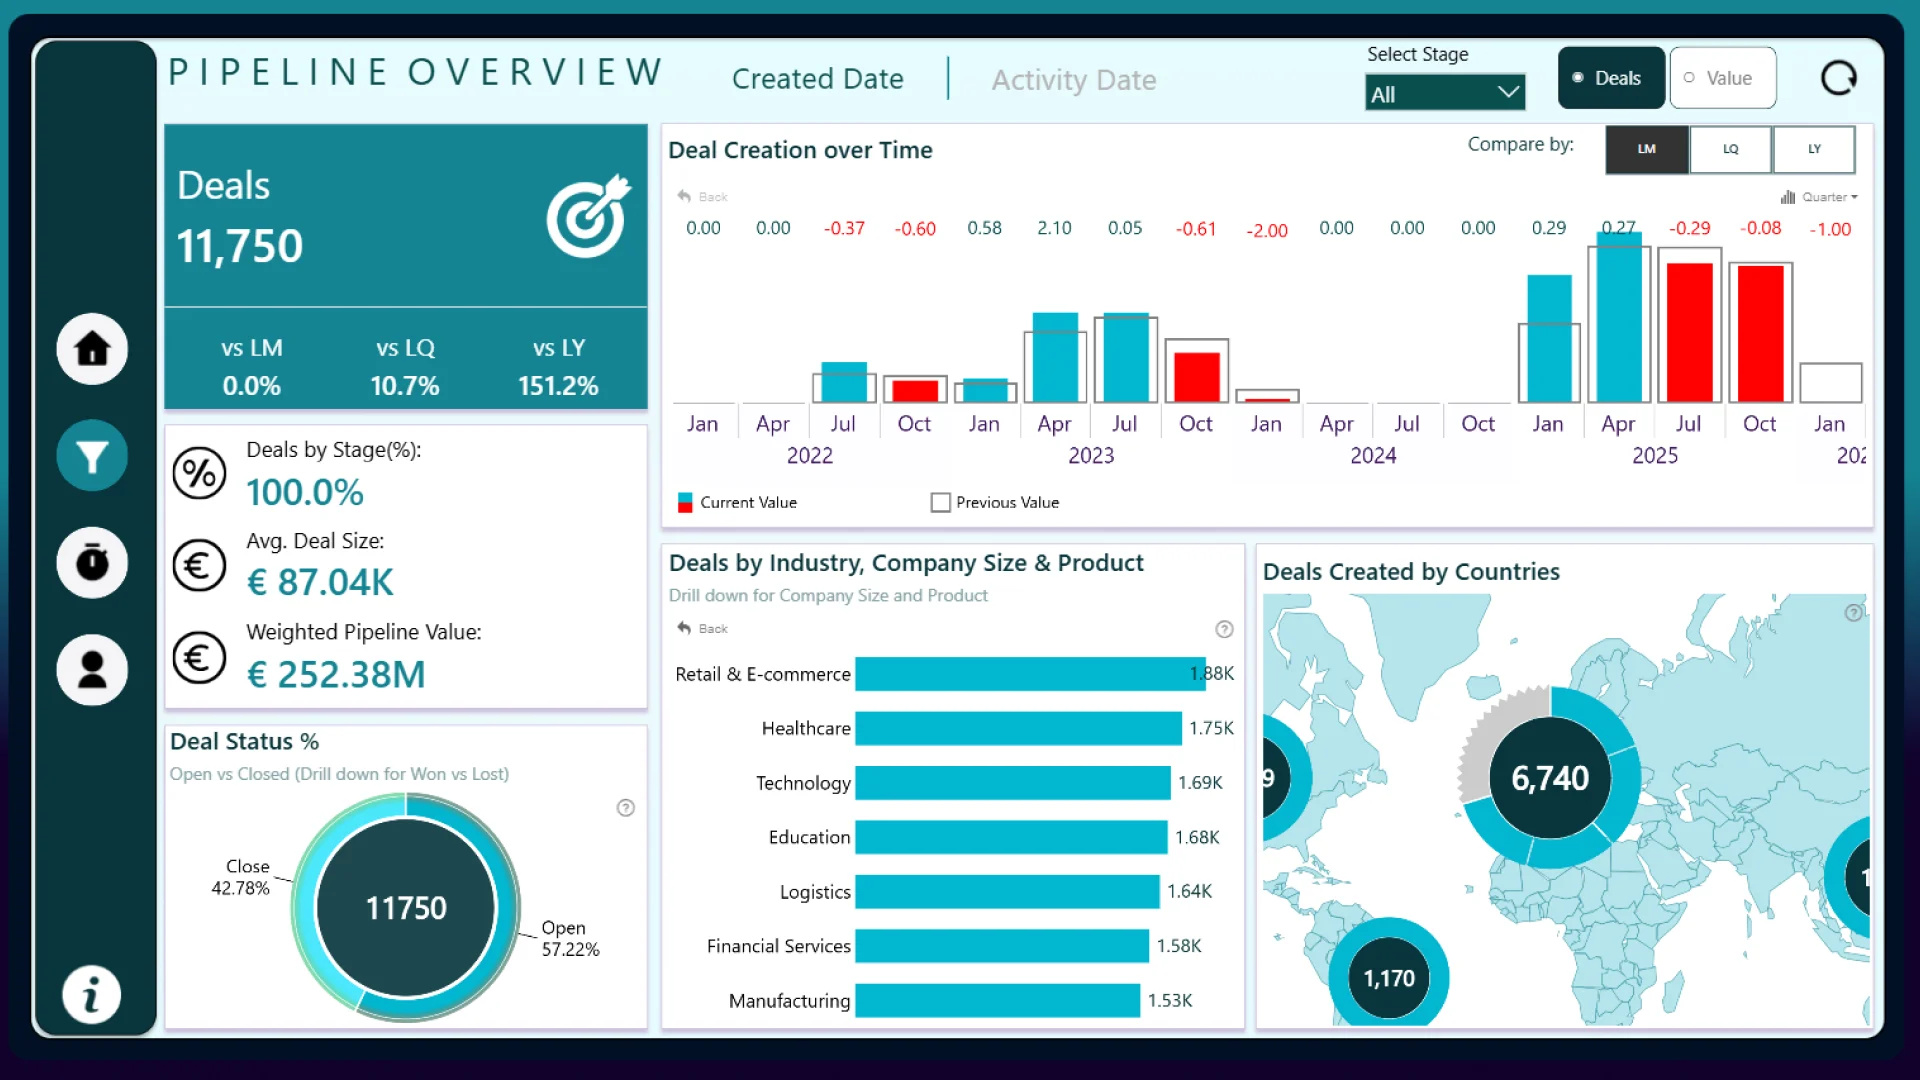
This interactive Power BI report explores the Global B2B Sales Pipeline & Deals Analytics dataset using ZoomCharts Drill Down PRO custom visuals for Power BI. It highlights pipeline value, deal progression, sales activity, and client engagement across regions and industries, helping teams monitor pipeline health and identify stalled or high-risk deals.
The report was submitted to the FP20 Analytics ZoomCharts Data Challenge #35 (February – March 2026).
Author’s Description:
This report provides a comprehensive view of the sales pipeline, including pipeline health, deal progression, and sales performance. It enables users to monitor active opportunities, analyze sales cycle efficiency, and identify high-performing sales activities and representatives.
Mobile view allows you to interact with the report. To Download the template please switch to desktop view.