logo
For Power BI
  • Products
    • Custom Visuals for Power BI
    • Report Templates
  • Resources

      Resources

    • Documentation
    • Report Examples
    • Blog
    • Webinars
    • Video Tutorials
    • Visuals Gallery

    Support

    • ZoomCharts Assistance
    • Contact Sales
    • Contact Support
    • FAQ

    Challenges

    Challenges

    Improve your report creation skills by participating in free challenges for report creators.

    Learn more
    Get Developer License
  • Services
    • Power BI Report Development
    • Custom Visual Development
  • Challenges
  • Pricing
Request a quote Get Developer License Sign in
Request a quote Book a Demo Get Developer License Sign in
Get it now
Go back

Contents

Reset your password

We'll email you instructions on how to reset your password

Go back

Share

Logo

Challenge 35: B2B Sales Pipeline & Deals Analytics

Feb 12 - Mar 13, 2026 | EDT

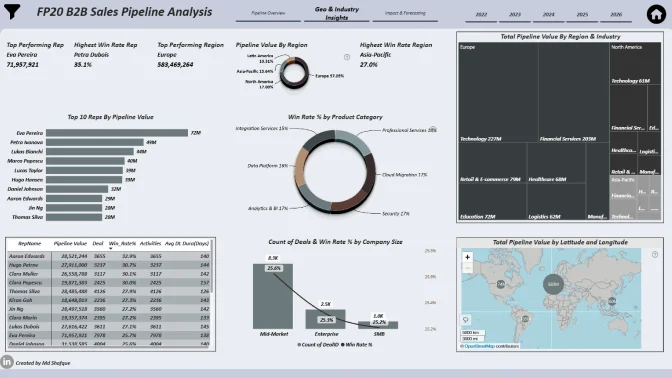
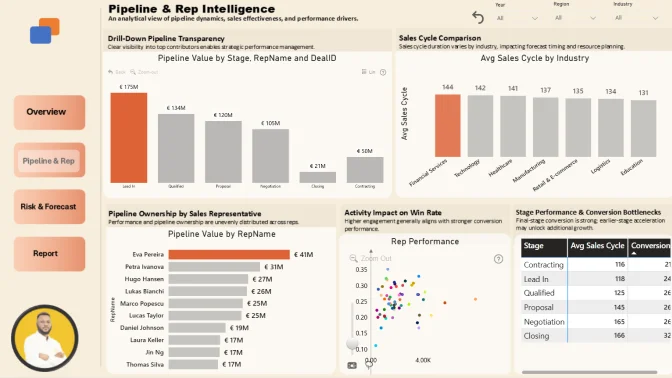
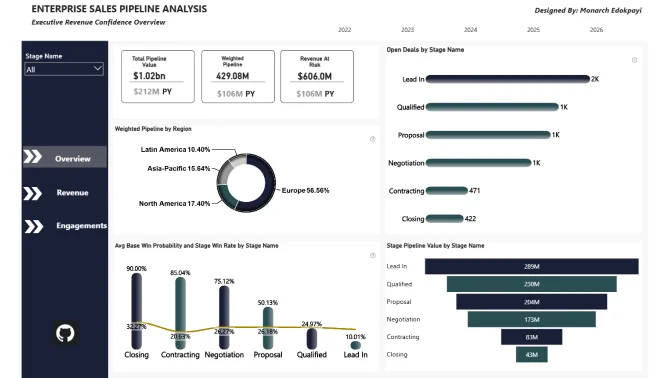
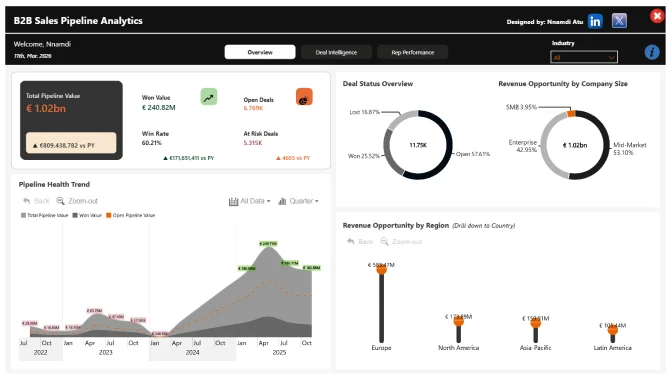
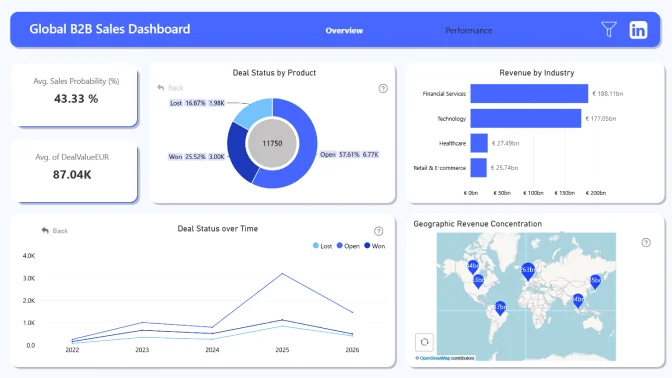
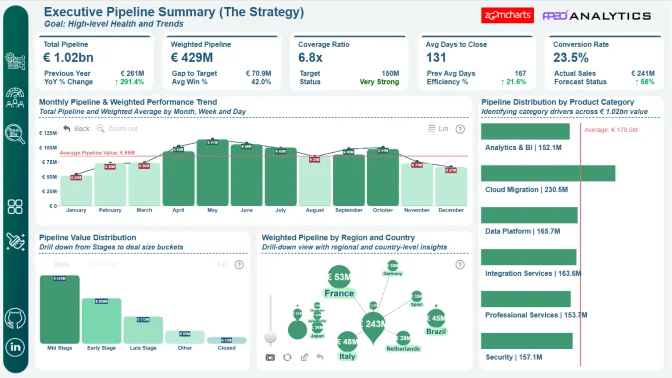
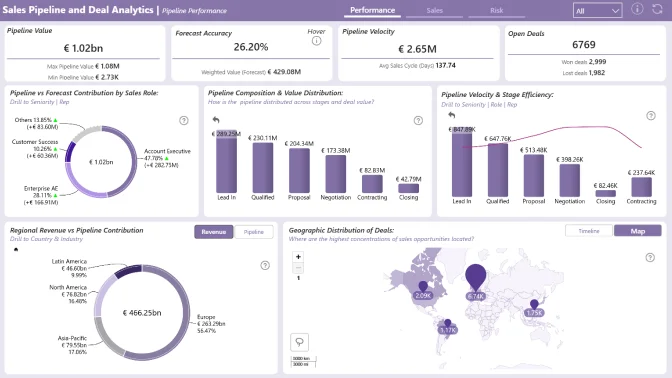
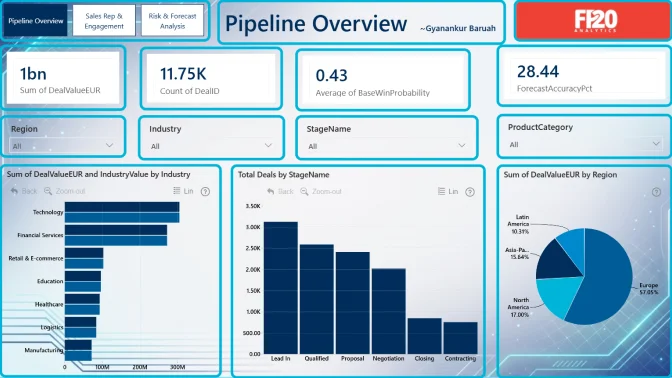
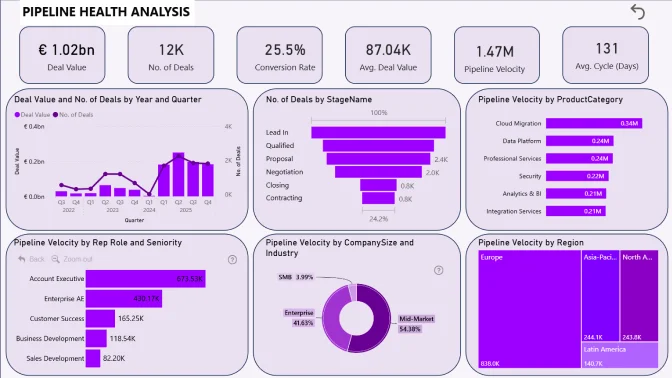
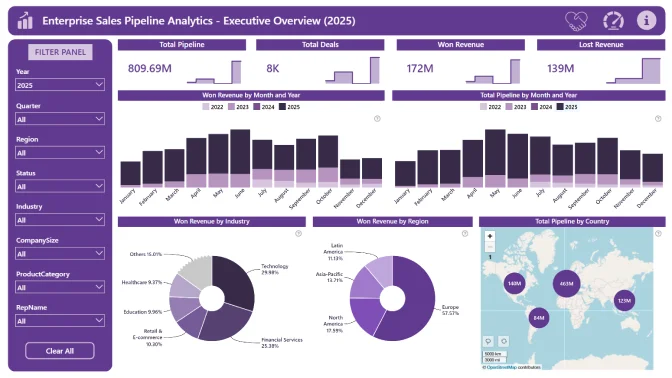
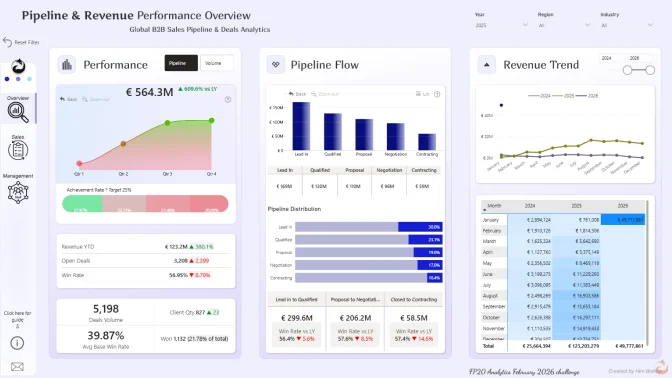
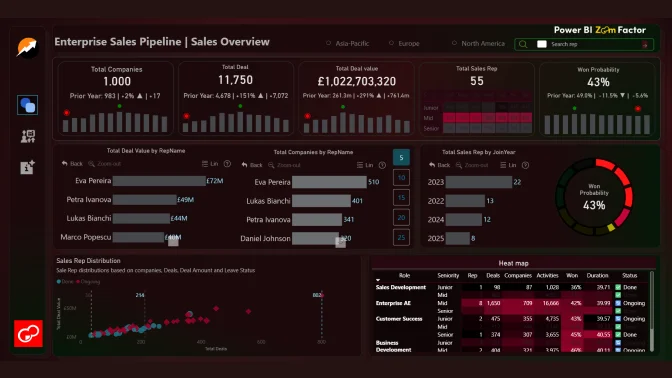
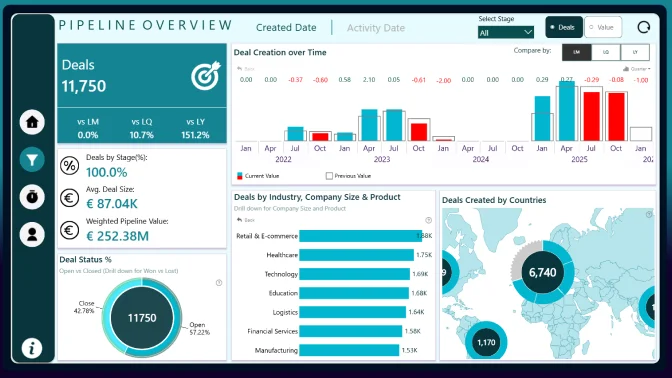
Build a Power BI report using a B2B SaaS dataset to analyze sales pipeline performance, track deals, monitor activity, and identify stalled opportunities across regions and industries.

Timeline

Registration Open

Registration Open

12 February | 04:00

-

Submissions Open

Submissions Open

12 February | 04:00

-

Workshop | Power BI for Sales Pipeline Analytics: Hands-On Dashboard Building

Workshop | Power BI for Sales Pipeline Analytics: Hands-On Dashboard Building

18 February | 08:00

-

1:1 Mentoring Sessions

1:1 Mentoring Sessions

18 February | 08:00

12 February - 10 March

Entry Submission Deadline

Entry Submission Deadline

10 March | 17:59

12 February - 10 March

Webinar | Top 5 Sales Pipeline Power BI Reports: Best Practices in Action

Webinar | Top 5 Sales Pipeline Power BI Reports: Best Practices in Action

13 March | 09:00

12 February - 10 March

Winner Announced

Winner Announced

13 March | 10:00

12 February - 10 March

Dataset

Get the dataset

See past FP20 Analytics challenges

See past challenges

Share the challenge

Submitted Reports
About challenge
How to participate
The Brief
Judging criteria
Timeline
Dataset
Past challenges

Winner of the challenge

Report Card

B2B Sales Pipeline Power BI Report

Author: Odunlami Zainab

36

View Report

All Submissions

Report Card

Sales Pipeline & Deals Analytics Report

Author: Nnamdi Nwankwo

28

View Report
Report Card

Sales Pipeline & Deals Analytics Report

Author: Aakash M

27

View Report
Report Card

B2B Sales Pipeline Dashboard

Author: Kapila Karunakara

24

View Report
Report Card

B2B Sales Pipeline Power BI Report

Author: Abu Bakar awan

19

View Report
Report Card

B2B Sales Pipeline Power BI Report

Author: Crystal Andrea Dsouza

15

View Report
Report Card

Sales Pipeline & Deals Analytics Report

Author: Chau Nguyen

19

View Report
Report Card

Sales Pipeline Dashboard

Author: Sherif Olalekan

0

View Report
Report Card

B2B Sales Pipeline Dashboard

Author: Md Shafque

2

View Report
Report Card

Sales Pipeline Dashboard

Author: Kolawole Olajide

0

View Report
Report Card

Sales Pipeline Analysis

Author: Monarch Edokpayi

0

View Report
Report Card

B2B Sales Pipeline Analytics

Author: Nnamdi Atu

0

View Report
Report Card

B2B Sales Pipeline Dashboard

Author: Nico Rohner

0

View Report
Report Card

Sales Pipeline & Deals Analytics

Author: Syed Daniyal Ahmed

0

View Report
Report Card

B2B Sales Pipeline Power BI Report

Author: Jude Onuh

1

View Report
Report Card

Sales Pipeline & Deals Analytics

Author: Gyanankur Baruah

1

View Report
Report Card

Sales Pipeline & Deals Analytics

Author: IHEANYI EMENIKE

1

View Report
Report Card

Sales Pipeline Analytics Dashboard

Author: Akashdeep Dam

1

View Report
Report Card

Sales Pipeline Dashboard

Author: Him Tsang

0

View Report
Report Card

B2B Sales Pipeline Power BI Report

Author: Idowu Joshua

0

View Report
Report Card

Sales Pipeline & Deals Analytics Report

Author: Eszter Kovacs

0

View Report
Report Card

Enterprise Sales Pipeline Analysis

Author: Ugochukwu Nwasuruba

0

View Report
Report Card

B2B Sales Pipeline Power BI Report

Author: Casey Condran

0

View Report
Report Card

Sales Pipeline & Deals Analytics

Author: Sumeet Behera

0

View Report
Report Card

Sales Pipeline Dashboard

Author: Sushree Jena

0

View Report
Report Card

Sales Pipeline Power BI Analytics Report

Author: Victoria Ogwuche

0

View Report
Report Card

Sales Pipeline Dashboard

Author: Brian Ochigbo Sule

0

View Report
Report Card

Sales Pipeline & Deals Analytics

Author: Kenneth Amobi

0

View Report
Report Card

Sales Pipeline Dashboard

Author: Durvesh Patil

1

View Report
Report Card

B2B Sales Pipeline Power BI Report

Author: Oladimeji Michael

0

View Report
Report Card

Sales Pipeline & Deals Analytics

Author: Opeyemi Ayodeji

0

View Report
Report Card

B2B Sales Pipeline Power BI Report

Author: Ugwu Giveson

0

View Report
Report Card

Sales Pipeline & Deals Analytics Report

Author: yasmeen amjad

0

View Report
Report Card

Sales Pipeline & Deals Analytics

Author: Kudzaishe (Gabriel) Manyanya

0

View Report
Report Card

B2B Sales Pipeline Power BI Report

Author: Akindele Omolayo

1

View Report
Report Card

Enterprise Sales Pipeline Analytics

Author: Emilia Łapczyńska

0

View Report
Report Card

Sales Pipeline Dashboard

Author: AashriyaRawat Rawat

1

View Report
Report Card

Sales Pipeline Performance and Risk Analytics

Author: Douglas Atuboyedia

1

View Report
Report Card

Sales Pipeline Power BI Dashboard

Author: AravindTeja Bastipadu

1

View Report
Report Card

B2B Sales Pipeline Power BI Report

Author: Abraham Cyrman Jimenez

0

View Report

About the FP20 Analytics ZoomCharts Data Challenge

🏆 Main Prize: $300 Amazon Gift Card

Want to build professional Power BI reports and grow your portfolio?

This challenge helps you level up with expert feedback, hands-on workshops, webinars with MVPs, and visibility in our public results showcase. It’s a great way to learn, gain recognition, and connect with a supportive data community.

The challenge is hosted in partnership with FP20 Analytics - a LinkedIn community that brings together 20k+ passionate data professionals and helps new analysts improve their craft. It’s a welcoming space where you can practice, learn, and share your work with others. Learn more about the FP20 Analytics challenge on their website.


Benefits of joining FP20 Analytics ZoomCharts Challenge

➤ Live Workshops & 1:1 Mentoring

Learn directly from experienced Power BI professionals. Enjoy practical workshops on report-building techniques and book a one-on-one mentoring session to receive tailored advice on your submission.

➤ Personalized Feedback

Every participant receives detailed, constructive feedback on their report. It’s a valuable opportunity to improve your skills with real insights from seasoned analysts.

➤ Free ZoomCharts Custom Visuals License

All participants receive a ZoomCharts Developer License, giving you full access to the Drill Down PRO visuals library.

➤ Free Report Downloads

Each challenge participant with a validated report will receive 5 free downloads from the Power BI Report Gallery.

Prizes 🏆

  • The best report using ZoomCharts visuals will receive a $300 Amazon Gift Card.
  • Being selected in the Top 5 will grant you +10 free downloads from the Power BI Report Gallery.

The winners will be announced during a special live webinar on February 11.


Guest Judge of the Challenge

    Nina Ikpe, Power BI Developer


Webinar recordings

Recording thumbnail

Power BI for Sales Pipeline Analytics: Hands-On Dashboard Building

Join this hands-on Power BI workshop to explore enterprise sales pipeline data and build interactive, decision-ready reports in Power BI using innovative visuals and take part in the FP20 Analytics Data Challenge 35!

Watch the recording
Recording thumbnail

Top 5 Sales Pipeline Power BI Reports: Best Practices in Action

See the top 5 Power BI reports on sales intelligence analytics and learn how to build reports that stand out in storytelling, design, and interactivity. Webinar features best report submissions to FP20 Analytics x ZoomCharts Data Challenge 35.

Watch the recording

How to Participate in the FP20 Analytics & ZoomCharts Challenge

1. Register for the Challenge

  • Register using the form above on this page.

  • Download the dataset using the Get the Dataset button on the left side of the page.

  • Read the challenge brief in the The Brief section to understand the data and requirements.

  • Activate your free Drill Down Visuals Developer License for Power BI. (watch the setup video or follow the step-by-step instructions).


2. Build Your Report in Power BI

  • Add your ZoomCharts license to Power BI Desktop.

  • Add ZoomCharts visuals from the Power BI visuals library or Microsoft Marketplace.

  • Build your report using the challenge dataset.
    Your report must include at least two ZoomCharts Drill Down Visuals on the same page.

  • Recommended report format:

    • Up to 3 pages (including any drill-through pages)

    • Canvas size: 16:9 (default) or 1920 × 1080 (Full HD)


3. Improve Your Report and Learn New Skills

  • Join the challenge workshop to learn how to use ZoomCharts visuals effectively.

  • If you need help, book a free 1-on-1 consultation with the ZoomCharts team.

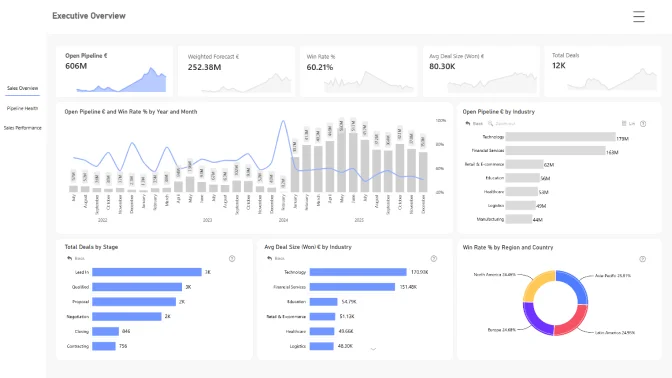
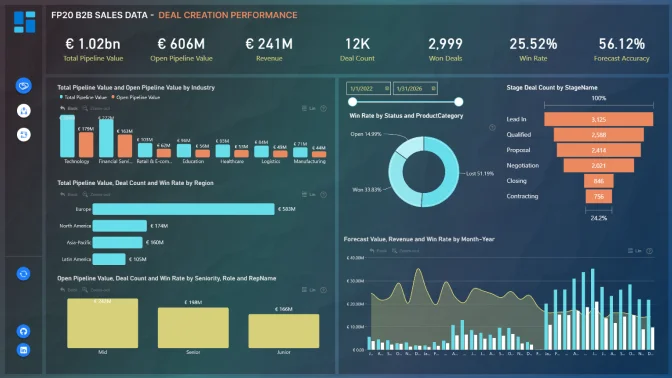
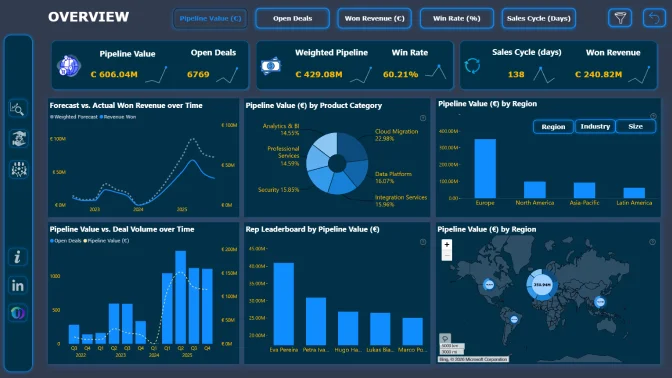
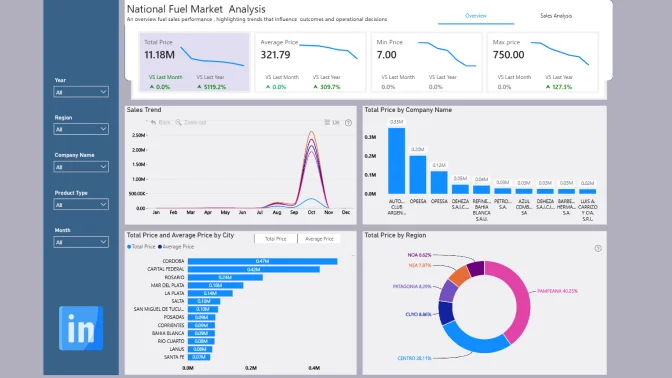
  • Look at previous challenge submissions for ideas and inspiration.


4. Submit Your Challenge Entry

  • Log in to your account on this page and upload your report in .pbix format for validation.

If your report does not meet all requirements:
You will receive an email explaining what needs to be fixed.
You can update your report and submit it again.

Validation timeline:

  • Your report will be reviewed within 1–2 business days.

  • Once validated, you will receive a Publish to Web link that you can use in your portfolio or share online.

  • You will also receive personalized feedback within 1–2 business days to help you improve your report before the deadline.

Note:
You may resubmit your entry as many times as needed before the challenge deadline.


5. Finalize Your Participation to Compete for the ZoomCharts Grand Prize

To be eligible for prizes, complete these steps:

  1. Post the final version of your report (PDF) on your LinkedIn profile.

  2. Use this caption:
    "I am participating in FP20 Analytics ZoomCharts Challenge 33"

  3. Include a short summary of your key insights and the Publish to Web link (if you have one).

  4. Use the hashtags #FP20Analytics and #builtwithzoomcharts and tag @Federico Pastor and @ZoomCharts.

  5. Obligatory! Share your report also in the FP20 Analytics LinkedIn Community group.

  6. Follow ZoomCharts on LinkedIn.

  7. Rate ZoomCharts visuals at Microsoft Marketplace.

6. Attend the Live Closing Webinar

  • The ZoomCharts team reviews and analyzes the Top 5 challenge submissions during live webinar.

  • You will learn best practices, visualization tips, and new Power BI skills.

  • The winner of the best report receives a $300 Amazon gift card from ZoomCharts.

Technical requirements

  • Build your report using Power BI
  • The recommended number of pages in the report is up to 3 pages, including drill-through pages.
  • Canvas size is 16:9 (Default Power BI size) or Full HD size = w:1920 - h:1080 
  • The report should contain at least 2 ZoomCharts Drill Down visuals within a single page. See a practical guide for using Drill Down PRO visuals.

Challenge Brief

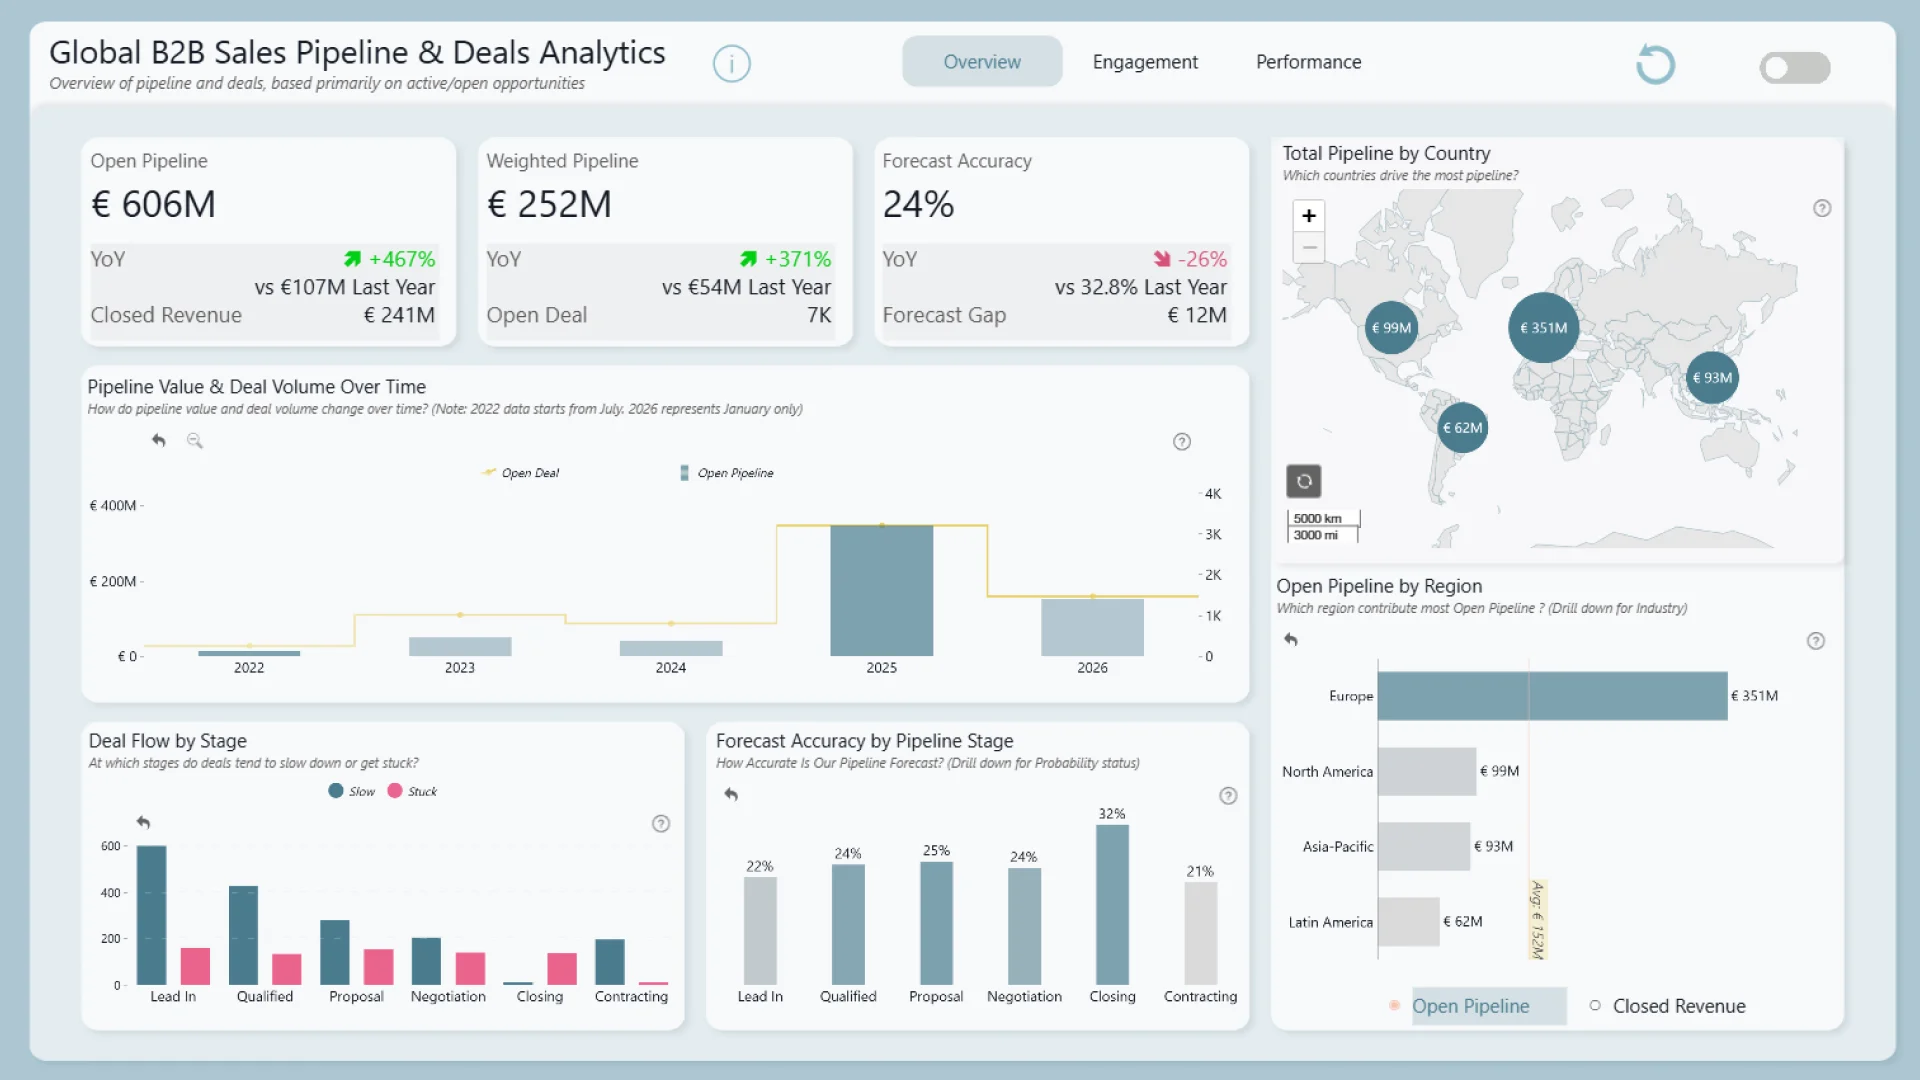
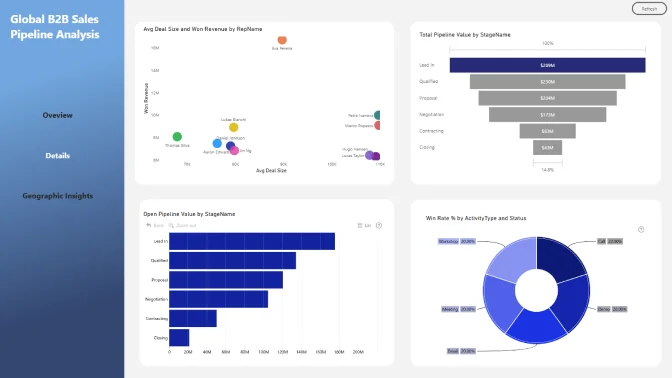
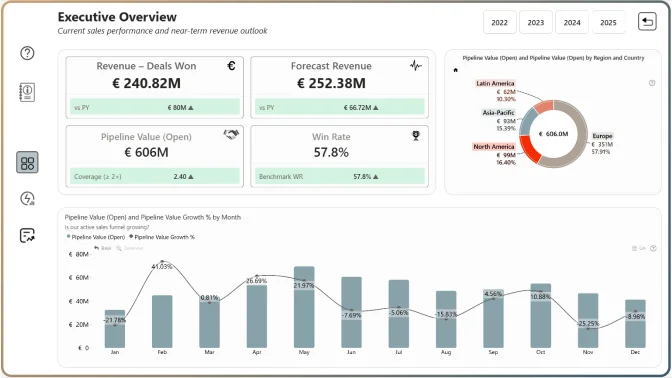
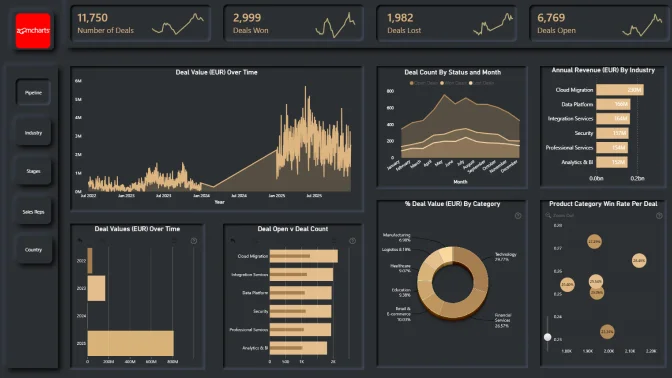
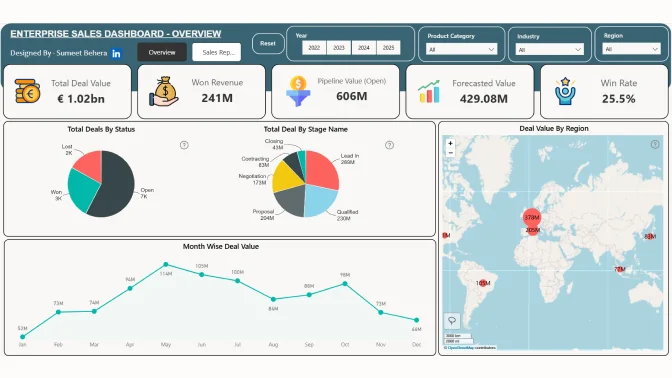
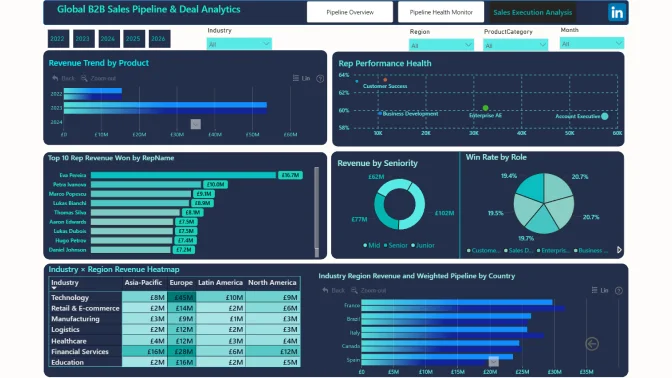
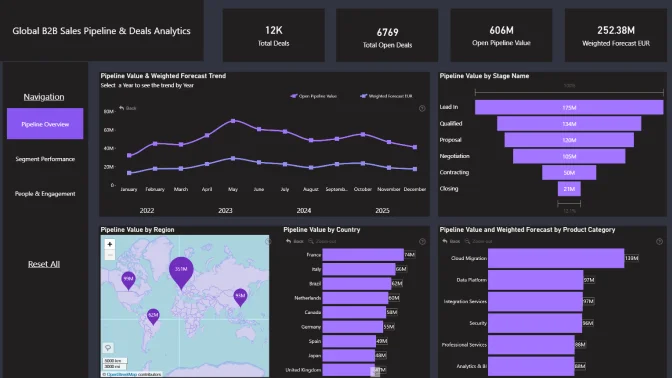
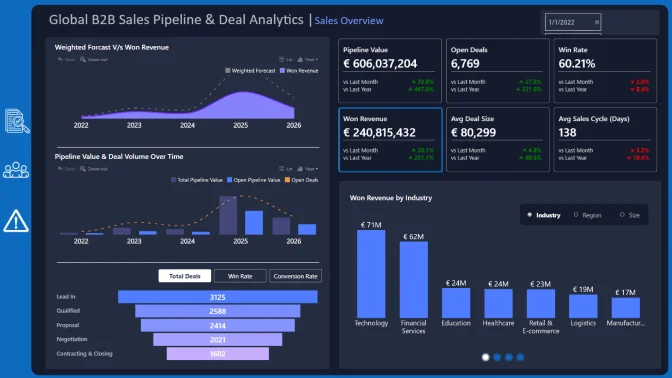
Global B2B Sales Pipeline & Deals Analytics Dataset

In this challenge, you will work with a realistic, enterprise-grade dataset representing a global B2B SaaS and Professional Services company. The dataset captures thousands of sales deals, customer companies, sales activities, and pipeline stages across multiple regions and industries.

Your task is to build an interactive Power BI report that sales managers, account executives, and business leaders can use as a *daily decision-making resource* for tracking deals, monitoring client engagement, and managing pipeline health.


Business Context

The company sells enterprise software platforms and professional services, including analytics tools, integration solutions, cloud migration services, and custom development projects. Sales cycles range from fast-moving SMB deals to long-running enterprise negotiations, requiring strong visibility into pipeline status, deal value, activity levels, and churn risk.

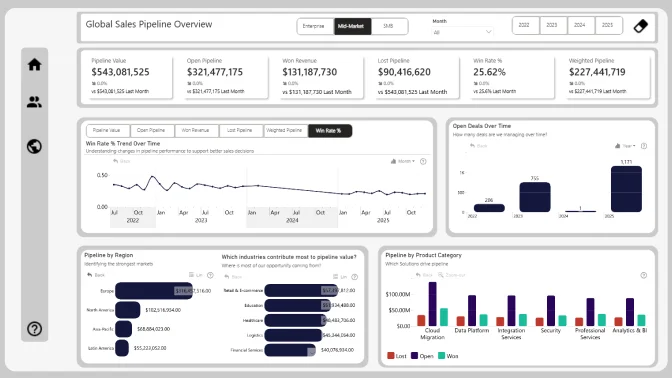
Sales managers need to quickly understand where deals are progressing, where they are stuck, and which clients require attention. Business leaders want confidence in forecasts and visibility into regional and industry performance.


Your Objective

Create a Power BI report that transforms raw sales pipeline data into clear, interactive insights. Your report should support daily sales operations as well as strategic decision-making.

Think beyond basic KPIs. Use visuals, drilldowns, and interactions to tell the story of how deals move through the pipeline and how relationships are built over time.


Key Questions to Explore

  • How does pipeline value and deal volume change over time, and are there seasonal patterns?
  • Which industries, regions, and company sizes contribute most to pipeline value and closed revenue?
  • Where do deals slow down or get stuck in the pipeline?
  • Which sales representatives manage the healthiest pipelines?
  • How does client engagement (calls, meetings, demos) relate to deal success?
  • Which open deals show high churn risk due to inactivity?
  • How can sales managers use this report as a daily tracking tool?

Judging criteria

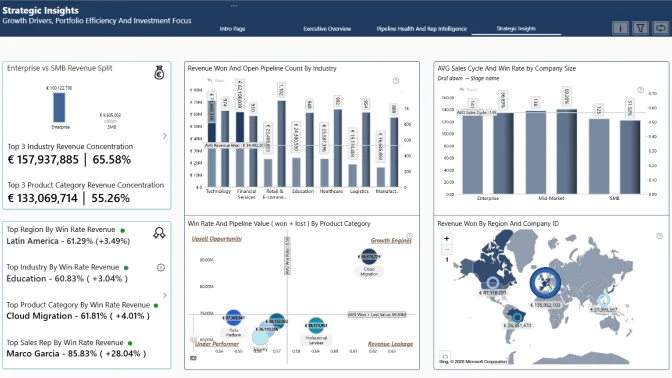
Business users use reports to make data-driven decisions. That’s why reports are called effective if they enable users to drill down and filter data quickly and intuitively to find answers to any question they might have, and analyse data in all possible directions and dimensions.

Each report is evaluated based on three main criteria: intuitiveness, insightfulness, and interactivity. These factors ensure that the reports are not only accurate and functional, but also meet the target audience's needs and are ready to be presented to the end-users. 


  1. Intuitive: How clear and easy it is to understand the report at a glance? (max 15 points)
    • Is the report visually appealing?
    • Choice of charts and visual elements
    • Does the report tell a story?
    • Is it not overwhelming to the user?
    • Choice of tooltips, titles, and legends

  2. Interactive: How engaging and seamless is the report exploration and interaction with data? (max 15 points)
    • Clear navigation that allows user to explore the report
    • Use of slicers and other interactive elements
    • Smooth cross-chart integration
    • Is report optimized for touch devices?
    • Are tutorials and guiding elements helpful to the user?

  3. Insightful: How accurate, complete, and meaningful is the data in driving decisions? (max 15 points)
    • Depth of analysis
    • Data cleaning and preparation
    • Does data show up accurately in the report?
    • Is report optimized for quicker loading time?
    • Does the report provide deeper exploration of data (drill-down)?

Timeline

Registration Open

Registration Open

12 February | 04:00

-

Submissions Open

Submissions Open

12 February | 04:00

-

Workshop | Power BI for Sales Pipeline Analytics: Hands-On Dashboard Building

Workshop | Power BI for Sales Pipeline Analytics: Hands-On Dashboard Building

18 February | 08:00

-

1:1 Mentoring Sessions

1:1 Mentoring Sessions

18 February | 08:00

12 February - 10 March

Entry Submission Deadline

Entry Submission Deadline

10 March | 17:59

12 February - 10 March

Webinar | Top 5 Sales Pipeline Power BI Reports: Best Practices in Action

Webinar | Top 5 Sales Pipeline Power BI Reports: Best Practices in Action

13 March | 09:00

12 February - 10 March

Winner Announced

Winner Announced

13 March | 10:00

12 February - 10 March

Dataset

Get the dataset

See past FP20 Analytics February 2026 challenges

See past challenges

Your Drill Down Visuals Developers License

Use the email and password provided below to log in Power BI Desktop and access an account with a license to use all ZoomCharts Drill Down Visuals.

Upon logging in, you will need to change your password and enable two-factor authentication. If you encounter any problems, feel free to reach out to us via chat.

*This Developer License can be used to create a report for this ZoomCharts Mini Challenge or for your personal training purposes. Commercial use of this license is prohibited.

Upload failed
Attach file
File requirements: 16MB

Any questions? Feel free to use chat!

Are you sure you want to delete the report?

Activate your Drill Down visuals Developer License!

You can use these credential to access ZoomCharts visuals and create your report for this ZoomCharts Mini Challenge, or for your personal training purposes.


Get ZoomCharts Developer License Select this option if you already have a Microsoft work or school account to activate and use ZoomCharts visuals in Power BI Desktop.

Activate your free developer license to use Drill Down visuals in your challenge report.


Create a free Microsoft account To install ZoomCharts visuals from the Power BI marketplace, you need a Microsoft account.

Don’t have a Microsoft account yet? Create a free account to build reports and join challenges.


logo
[email protected]
+44 204 577 3993
logo

Products

Drill Down Bubble PRO Drill Down Line PRO Drill Down Network PRO Drill Down Waterfall PRO Drill Down Graph PRO Drill Down Combo PRO Drill Down Combo Bar PRO Drill Down Donut PRO Drill Down Pie PRO Drill Down TimeSeries PRO Drill Down Timeline PRO Drill Down Map PRO Drill Down Scatter PRO All Visuals

Resources

Report Examples Webinars Blog ZoomCharts Academy Visuals Gallery Documentation Custom Visual Development Subscribe to News

Solutions

Custom Visual Development

Company

Pricing About Us Partners Leave feedback Join PowerGroup EU Funding

Help

ZoomCharts Assistance Contact Sales Contact Support FAQ AI Information

Drill Down Line PRO Drill Down Bubble PRO Drill Down Network PRO Drill Down Waterfall PRO Drill Down Graph PRO Drill Down Combo PRO Drill Down Combo Bar PRO Drill Down Donut PRO Drill Down Pie PRO Drill Down TimeSeries PRO Drill Down Timeline PRO Drill Down Map PRO Drill Down Scatter PRO All Visuals

Report Examples Webinars Blog ZoomCharts Academy Visuals Gallery Documentation Custom Visual Development Subscribe to News

Custom Visual Development

Pricing About Us Partners Leave feedback Join PowerGroup EU Funding

ZoomCharts Assistance Contact Sales Contact Support FAQ AI Information
+44 204 577 3993
[email protected]

Ready to get in touch?

Contact our experts with any question about Power BI and ZoomCharts for Free!

Contact us

© 2026, Data Visualization Software Lab

U.S. Patents No. 11,645,343; 11,921,804; 12,346,389

Cookies
Privacy Policy
Global
Legal
Patent
warning

Error message

success

Success info: Done!

ZoomCharts AI Assistant

We noticed you're using an old OS version.

For the best experience, we recommend upgrading to ensure that all website features display correctly.

Cookie settings

We use necessary cookies for site functionality, as well as statistic, marketing, and preference cookies to enhance your experience. For more information and to manage your preferences, please visit our Cookie policy