Feel free to leave your vote:
19
Share template with others
Summary
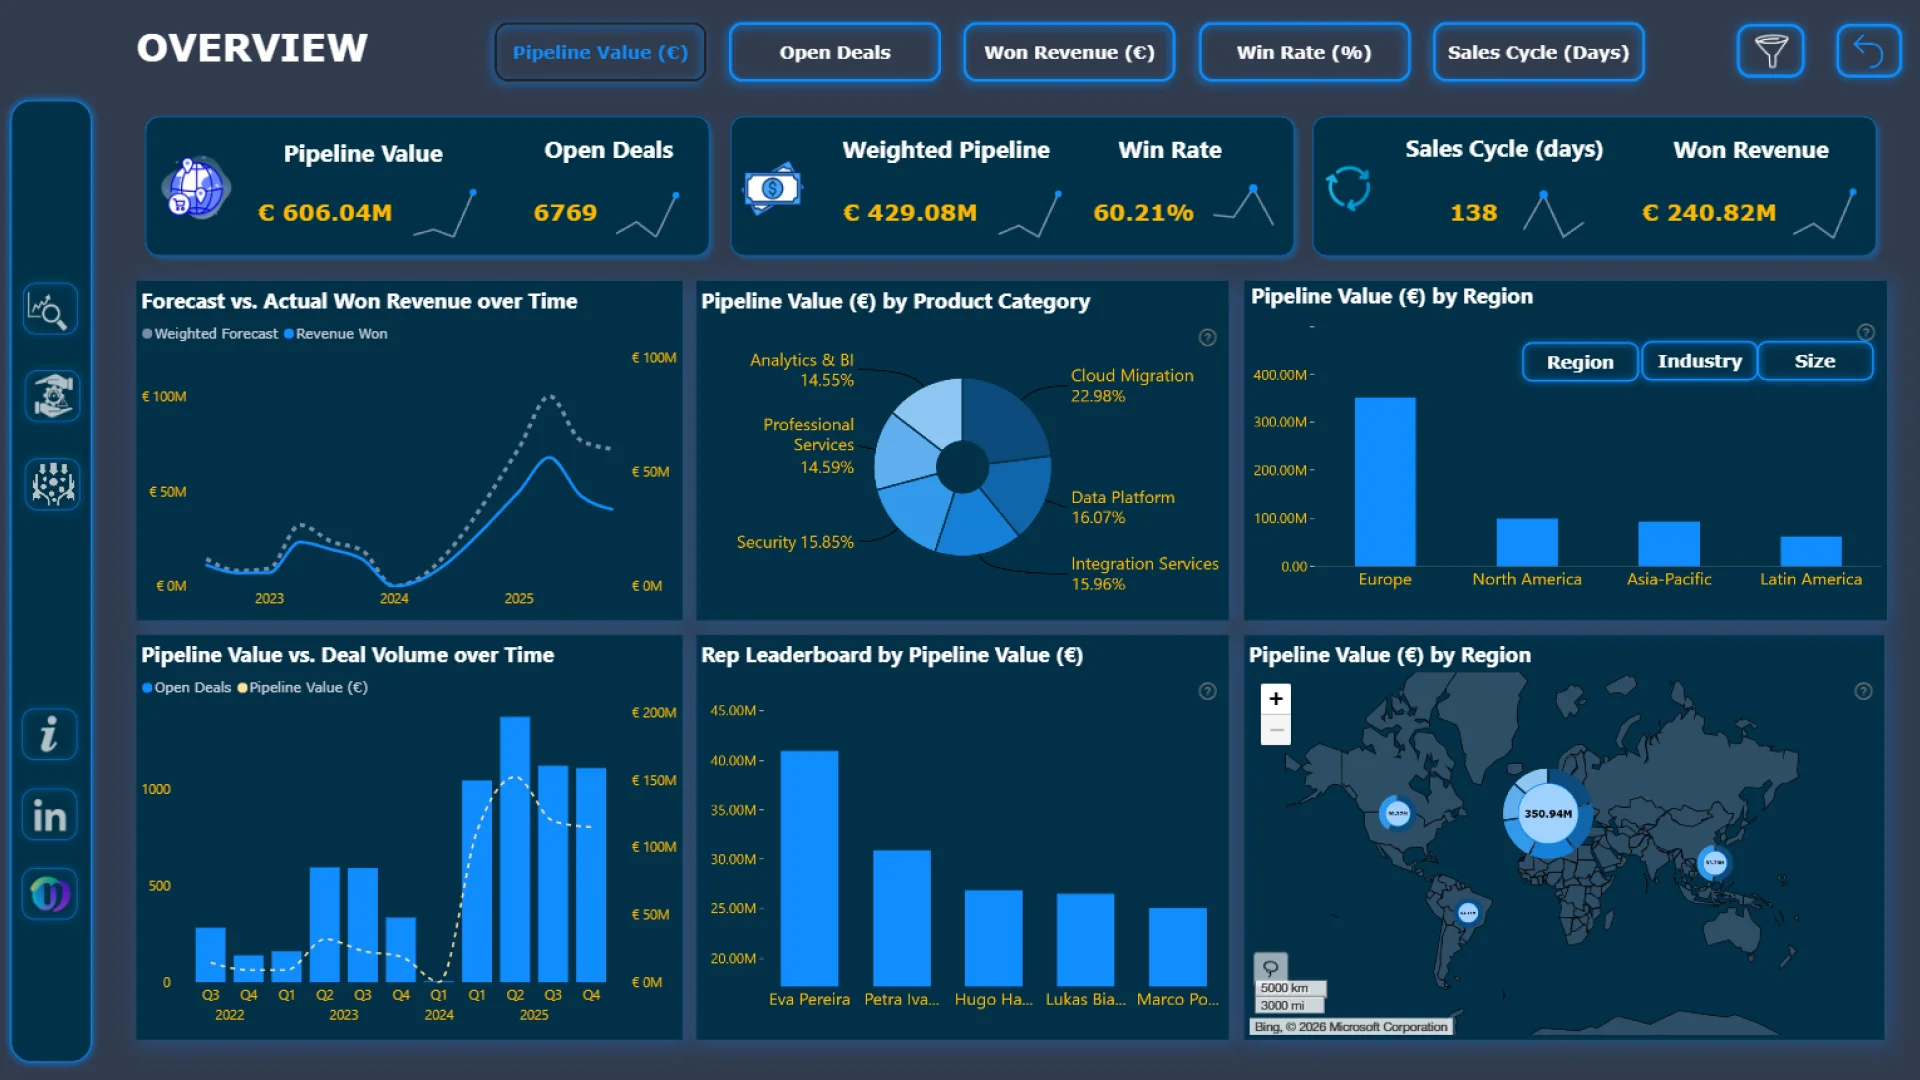
This interactive Power BI report explores the Global B2B Sales Pipeline & Deals Analytics dataset using ZoomCharts Drill Down PRO custom visuals for Power BI. It highlights pipeline value, deal progression, sales activity, and client engagement across regions and industries, helping teams monitor pipeline health and identify stalled or high-risk deals.
The report was submitted to the FP20 Analytics ZoomCharts Data Challenge #35 (February – March 2026).
Author’s Description
This report analyzes the Global B2B Sales Pipeline to identify revenue efficiency gaps, conversion friction, and financial risk exposure. It covers pipeline health, team performance, and risk diagnostics to help improve forecasting and deal progression. Key insights show that Europe leads in pipeline value, while Technology and Financial Services dominate revenue contribution, creating industry concentration risk. Despite stable win rates across the team, over 80% of open deals show inactivity, highlighting significant pipeline risk and the need for stronger governance.
ZoomCharts visuals used
Mobile view allows you to interact with the report. To Download the template please switch to desktop view.