Feel free to leave your vote:
0
Share template with others
Summary
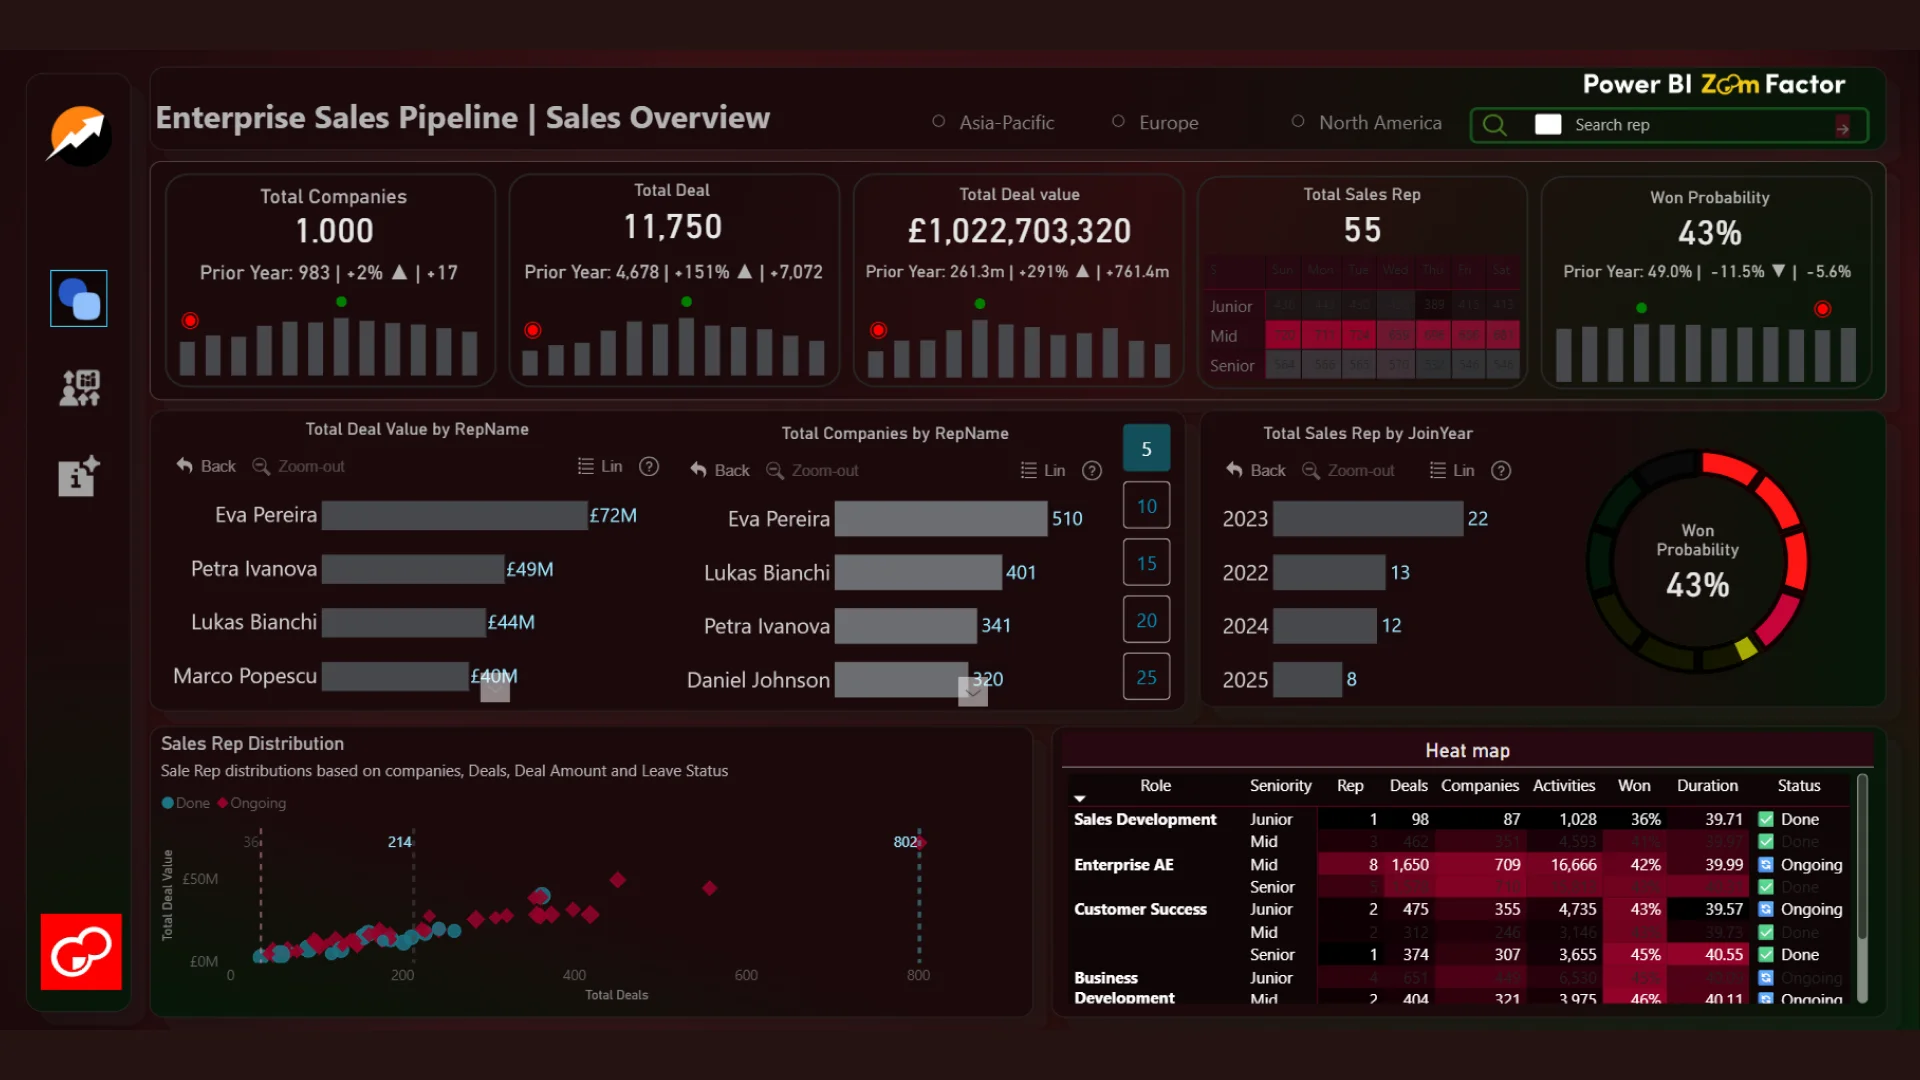
This interactive Power BI report explores the Global B2B Sales Pipeline & Deals Analytics dataset using ZoomCharts Drill Down PRO custom visuals for Power BI. It highlights pipeline value, deal progression, sales activity, and client engagement across regions and industries, helping teams monitor pipeline health and identify stalled or high-risk deals.
The report was submitted to the FP20 Analytics ZoomCharts Data Challenge #35 (February – March 2026).
Author’s Description
The sales pipeline currently includes 11,750 deals from 1,000 companies, generating a total potential value of £1.02B with an average deal value of £87K. With a 43% win probability, 26% of deals already won, and 58% still open, the pipeline shows strong revenue potential if open opportunities are effectively converted.
Mobile view allows you to interact with the report. To Download the template please switch to desktop view.