logo
For Power BI Report Templates
  • Products

    Drill Down Visuals for Power BI

    Discover the most customizable custom visuals for Power BI.

    Pricing & licensing
    • Drill Down Donut Pro
      Drill Down Donut Category Composition
    • Drill Down Pie Pro
      Drill Down Pie Proportional Breakdown
    • Drill Down Combo Pro
      Drill Down Combo Multi-Metric Trends
    • Drill Down Combo Bar Pro
      Drill Down Combo Bar Cross-Metric Trends
    • Drill Down Line Pro
      Drill Down Line Trend Analysis
    • Drill Down Bubble Pro
      Drill Down Bubble Value Relationships
    • Drill Down Scatter Pro
      Drill Down Scatter Correlation Analysis
    • Drill Down Network Pro
      Drill Down Network Entity Connections
    • Drill Down Graph Pro
      Drill Down Graph Relationship Mapping
    • Drill Down Map Pro
      Drill Down Map Geographic Insights
    • Drill Down Waterfall Pro
      Drill Down Waterfall Change Breakdown
    • Drill Down Timeline Pro
      Drill Down Timeline Time-Based Metrics
    • Drill Down TimeSeries Pro
      Drill Down TimeSeries Temporal Patterns
    • Drill Down Line Pro
      Drill Down Line Trend Analysis

    Visuals in Planning

    Discover visuals we’re exploring, share your feedback, and help us decide what to build next.

    Browse concepts
  • Template Reports
    • Browse Report Templates
      Browse Report Templates Explore 2000+
      Power BI reports
    • Pricing Report Templates
      unlimited access

    Explore Report Templates

    Industry

    • Logistics
    • Education
    • Healthcare
    • Transportation
    • Banking
    • Ecommerce
    • Crime analytics
    • Retail
    • Manufacturing

    Business Domain

    • Sales
    • Marketing
    • Accounting & Finance
    • Human Resources
    • Research
    • Project Management
    • CRM
    • Support
    • Customer experience
  • Resources

      Learn

    • Video Tutorials Step-by-step Power BI guides
    • Webinars Live and recorded expert sessions
    • Visuals Gallery Explore all custom Power BI visuals
    • Blog Power BI tips, updates, and guides
    • Documentation Setup, features, and API reference

    Support

    • ZoomCharts Assistance Help from our product experts
    • Contact Sales Questions about pricing or licensing
    • Contact Support Technical help and troubleshooting
    • FAQ Quick answers to common questions
  • Services
    • Power BI Report Development
      Power BI Report Development End-to-end custom
      Power BI reports.
    • Custom Visual Development
      Custom Visual Development Custom visuals for
      your business needs.
  • Challenges
  • Pricing
Request a quote Get Developer License Sign in
Request a quote Book a Demo Get Developer License Sign in
Get it now
Go back

Contents

ZoomCharts Documentation

Up Down
Edit Category
Delete Save Add Child

Licensing States in Drill Down Visuals

The quickest way to check the license state is to open the information window in the ZoomCharts Drill Down visual. The information window shows the current license state and the visual version.


During the license lifecycle, the visual may show different messages, icons, and pop-ups. These states help you understand whether a license is required, active, expired, or needs attention. 


Free mode

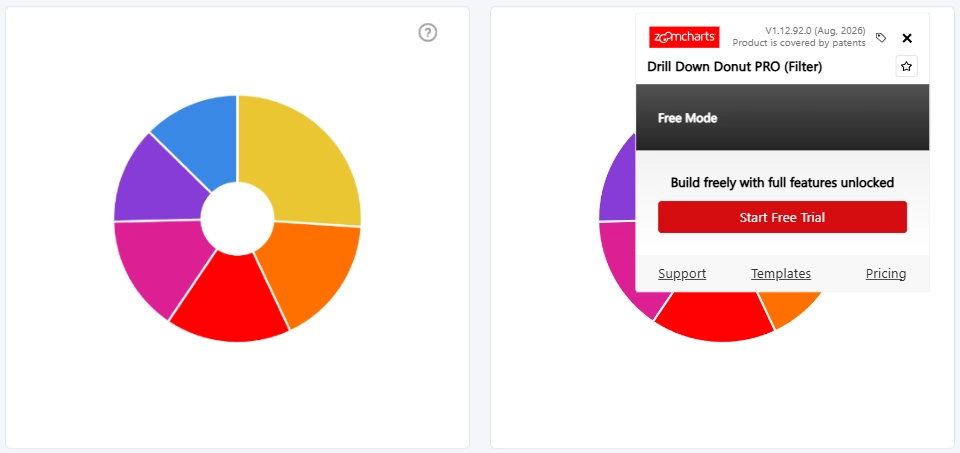
Free Mode means that no paid features are currently in use and no license is required. 


This state can appear when the visual is added to a report without data, or when data is added but no paid fields or paid features are used.


If a license is already applied, it is not displayed while the visual remains in Free Mode.
Free Mode

Free Mode - Active

Paid Mode Not Active

The Paid Mode Not Active message appears when paid features are used but Paid Mode has not been activated.


To continue, choose one of the following options:

  • Activate Paid Mode.
  • Return to a basic configuration by removing paid fields or paid features.
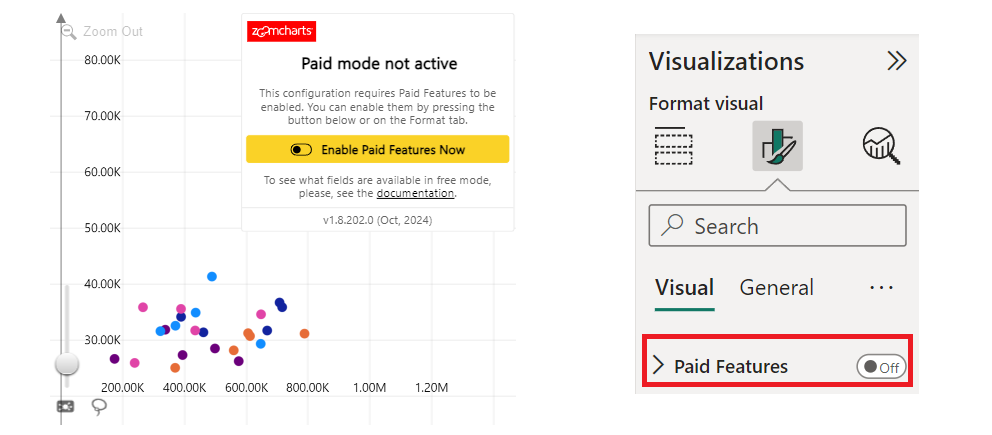
Paid Mode Not Active

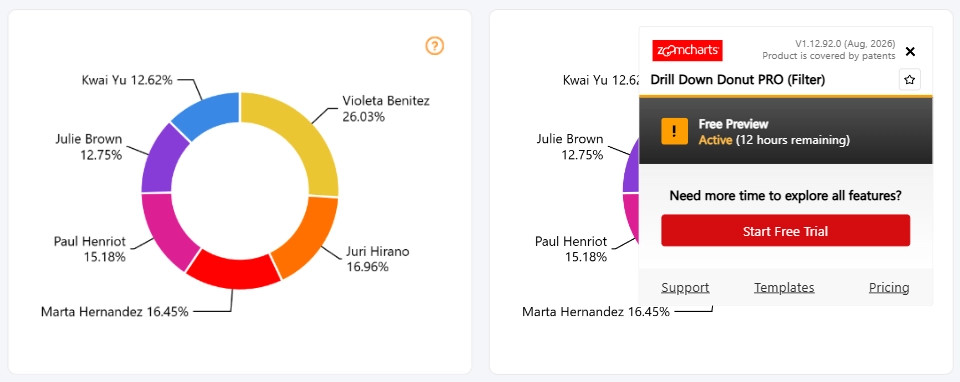
Free Preview

When you start using paid features, the visual starts a Free Preview. The preview gives access to all Drill Down Visuals features for 12 hours.


The information window shows the remaining preview time. After the preview period ends, paid features are no longer available.


To evaluate the visual for a longer period, sign up for a Developer License.

Free Preview

Developer License Active

Selecting Get Developer License opens the sign-up page for a free Developer License.


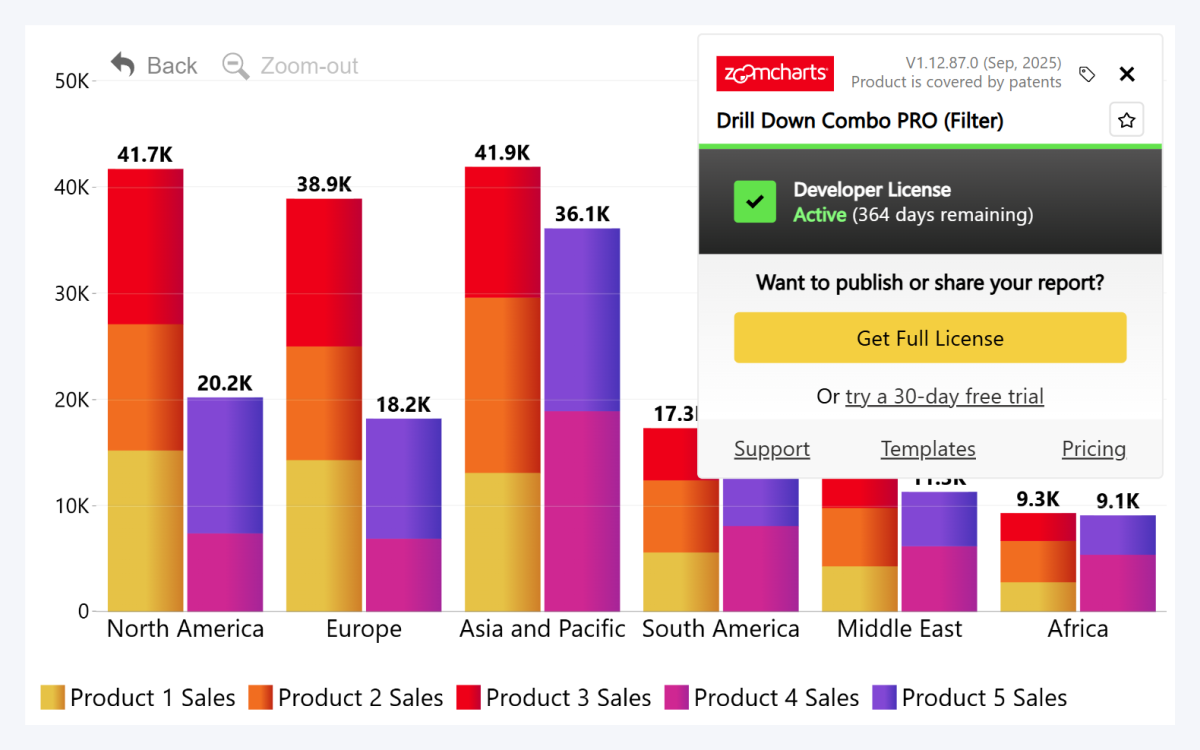
The Developer License allows you to use ZoomCharts Drill Down Visuals in Power BI Desktop for 1 year.


After signing up, you receive a license and can validate it in the visual. When the Developer License is active, the information window shows the active license state.


From this state, you can also:

  • Upgrade to a paid license.
  • Start a 30-day trial.

Both options allow you to use the visuals outside Power BI Desktop, including in published reports.

The Developer License is intended for use in Power BI Desktop only.

Developer License Active

Trial License

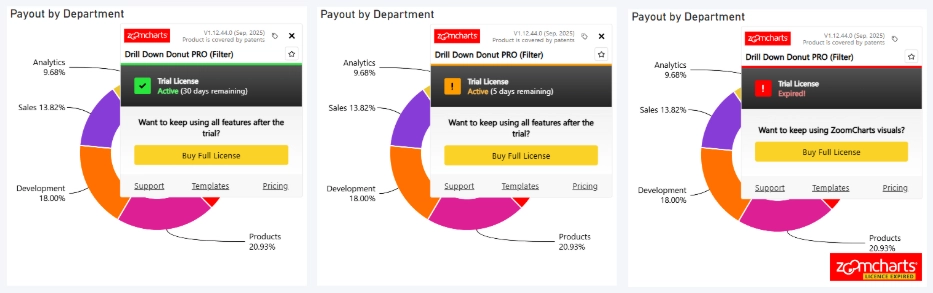
When a 30-day trial is active, the information window shows the trial license state.


If the trial is active, the license is valid and paid features are available.


Five days before the trial ends, the information button turns orange and the information window shows the remaining number of days.


After the trial expires, the visual shows a Trial Expired pop-up and the ZoomCharts logo. To continue using the visual, choose one of the following options:

  • Disable paid features and use the visual in Free Mode.
  • Apply a valid license.

Trial License

License Active

License Active means that a valid license is applied and paid features are available.


The information shown depends on how the license was applied.

  • Manually Applied License

    If the license was applied manually using a license key and hash, or by using a license theme, a license tag icon is shown.


    Hover over the license tag icon to view the service tag number.


    In this case, the License section is populated. This indicates that the license was purchased directly from ZoomCharts or provided as a manual license.
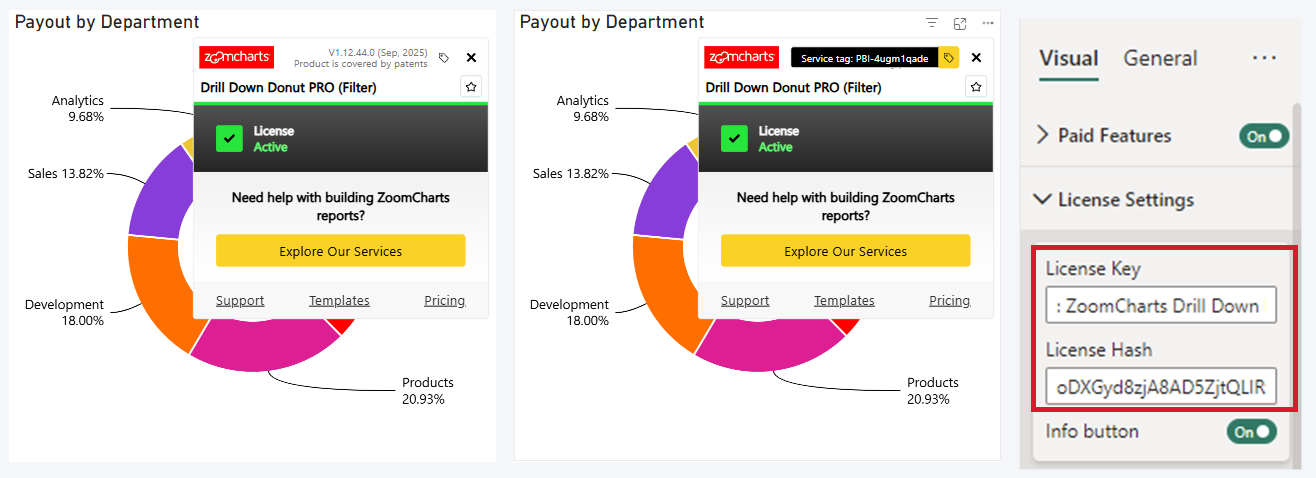
    License Active

  • AppSource License

    If the license is detected automatically through Microsoft 365 after a Microsoft AppSource purchase, the license tag icon is not shown.


    In this case, the License section remains empty because the license is managed through Microsoft.
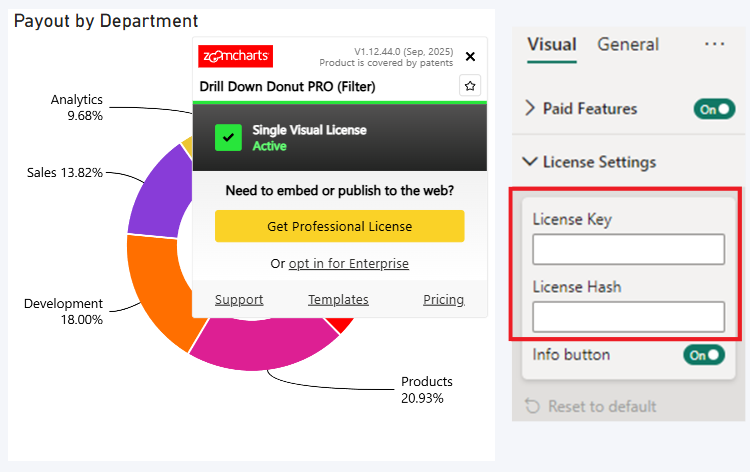
    License Active (AppSource License)

License Expired

The License Expired message appears when a manually applied license is no longer valid.


The visual also shows the ZoomCharts logo. To confirm that the expired license was applied manually, check whether the license tag icon is shown and whether the License section is populated.


To remove the message and continue using paid features, renew the license.
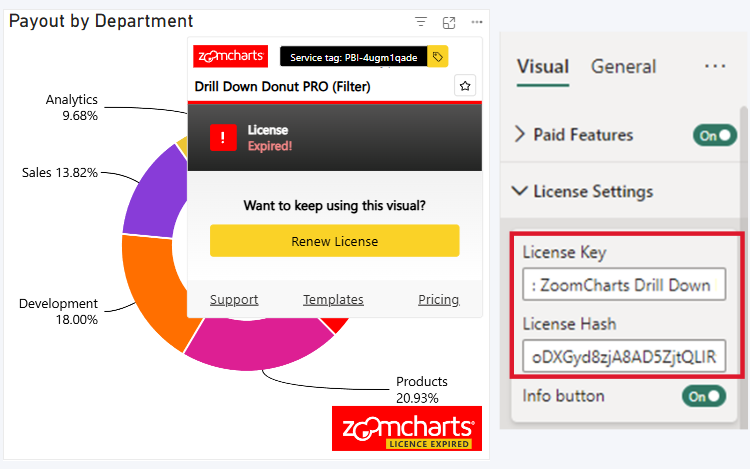
Licensing state: License Expired

License Invalid

The License Invalid message can appear in two cases.

  1. AppSource License Is No Longer Valid

    If the license was detected automatically through Microsoft 365, the License section remains empty.


    In this case, renew or manage the license in the Microsoft 365 admin center.

  2. Manual License Details Are Incorrect

    If the license was applied manually, the License section is populated.


    Check the license key and hash for:

    • Typos
    • Missing characters
    • Extra spaces
    • Incorrect values

    After the license details are corrected, the license becomes valid.
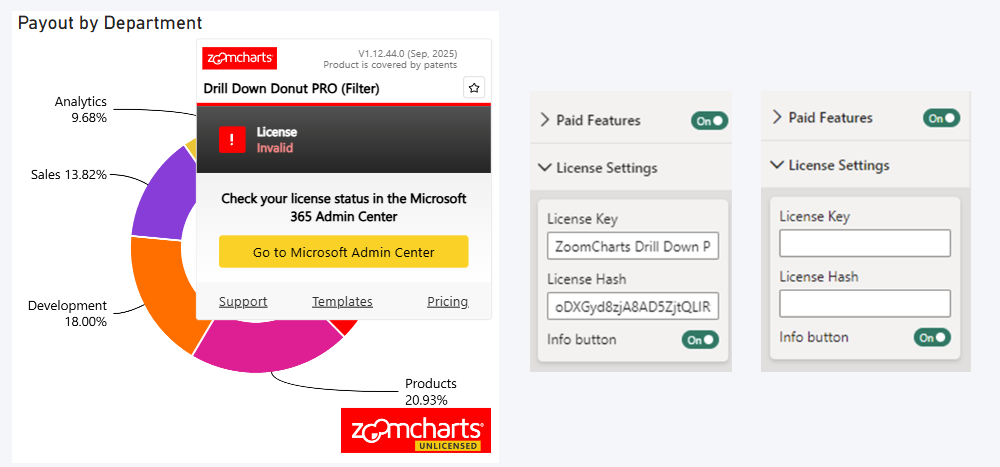
License Invalid

License Warning

The License Warning message applies to licenses detected automatically through Microsoft 365.


It means that the license is still valid, but there may be an issue with the subscription, such as a declined payment. If the issue is not resolved, the license may become invalid.


To resolve the issue, review the license or subscription status in the Microsoft 365 admin center.
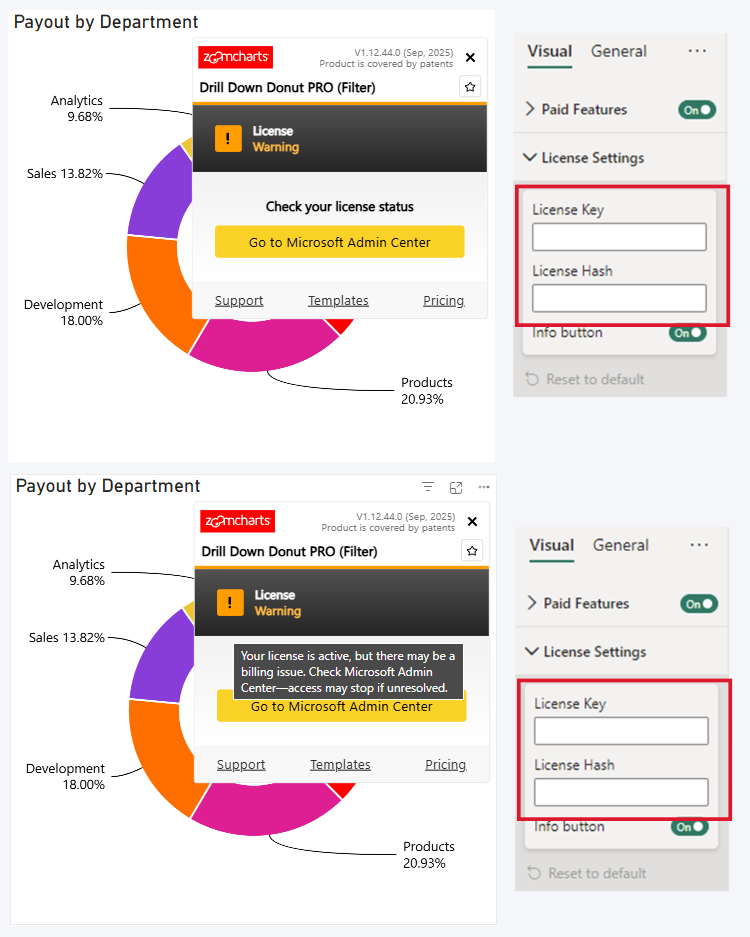
License Warning

Multiple License States In One Report

Licenses are detected separately for each individual visual.


Because of this, one report can contain multiple ZoomCharts visuals with different license states. This can happen when different licensing methods are used in the same report, such as an AppSource license for one visual and a manually applied license key and hash for another.

Was this helpful? Thank you for your feedback!

Sorry about that.

How can we improve it?

logo
[email protected]
+44 204 577 3993
logo

Products

Drill Down Bubble PRO Drill Down Line PRO Drill Down Network PRO Drill Down Waterfall PRO Drill Down Graph PRO Drill Down Combo PRO Drill Down Combo Bar PRO Drill Down Donut PRO Drill Down Pie PRO Drill Down TimeSeries PRO Drill Down Timeline PRO Drill Down Map PRO Drill Down Scatter PRO All Visuals

Resources

Report Examples Webinars Blog ZoomCharts Academy Visuals Gallery Documentation Custom Visual Development Subscribe to News

Solutions

Custom Visual Development

Company

Pricing About Us Partners Leave feedback Join PowerGroup EU Funding

Help

ZoomCharts Assistance Contact Sales Contact Support FAQ AI Information

Drill Down Line PRO Drill Down Bubble PRO Drill Down Network PRO Drill Down Waterfall PRO Drill Down Graph PRO Drill Down Combo PRO Drill Down Combo Bar PRO Drill Down Donut PRO Drill Down Pie PRO Drill Down TimeSeries PRO Drill Down Timeline PRO Drill Down Map PRO Drill Down Scatter PRO All Visuals

Report Examples Webinars Blog ZoomCharts Academy Visuals Gallery Documentation Custom Visual Development Subscribe to News

Custom Visual Development

Pricing About Us Partners Leave feedback Join PowerGroup EU Funding

ZoomCharts Assistance Contact Sales Contact Support FAQ AI Information
+44 204 577 3993
[email protected]

Ready to get in touch?

Contact our experts with any question about Power BI and ZoomCharts for Free!

Contact us

© 2026, Data Visualization Software Lab

U.S. Patents No. 11,645,343; 11,921,804; 12,346,389

Cookies
Privacy Policy
Global
Legal
Patent
warning

Error message

success

Success info: Done!

ZoomCharts AI Assistant

We noticed you're using an old OS version.

For the best experience, we recommend upgrading to ensure that all website features display correctly.

Cookie settings

We use necessary cookies for site functionality, as well as statistic, marketing, and preference cookies to enhance your experience. For more information and to manage your preferences, please visit our Cookie policy