Category
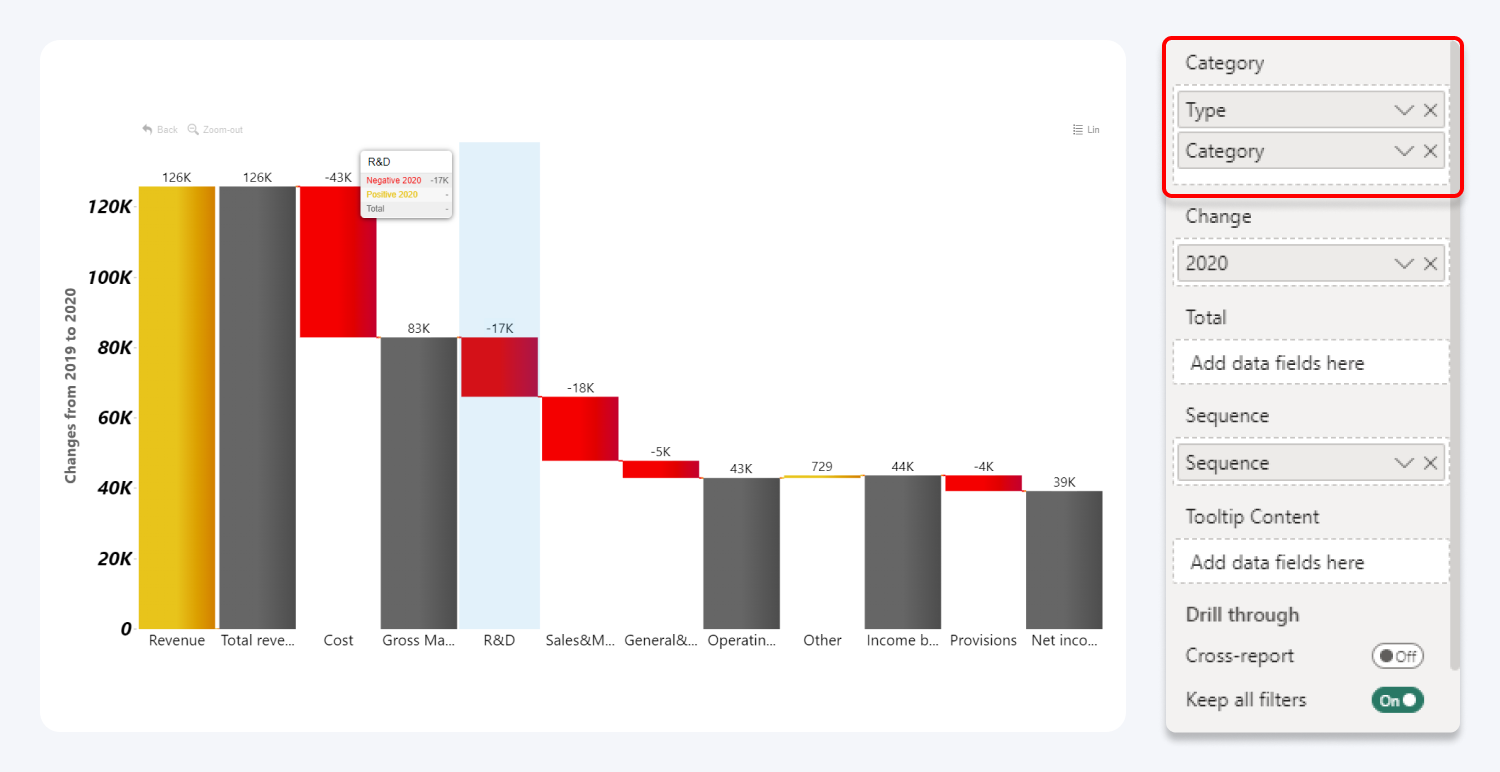
Category field allows you to define the categories, for which the changes will be displayed. Revenue per product group or change in human resources per department would be few examples for categories that could be used in a waterfall visual. Category field also accepts date and date hierarchy as data type.
Category field is mandatory. Visual can’t be render without it.
If you add more than 1 column in this field, this will allow you to drill-down to the next level. For example, you can plot changes in human resources per each subsidiary, and then drill-down to the next level to see changes per each department within specific subsidiary.

Was this helpful? Thank you for your feedback!
Sorry about that.
How can we improve it?