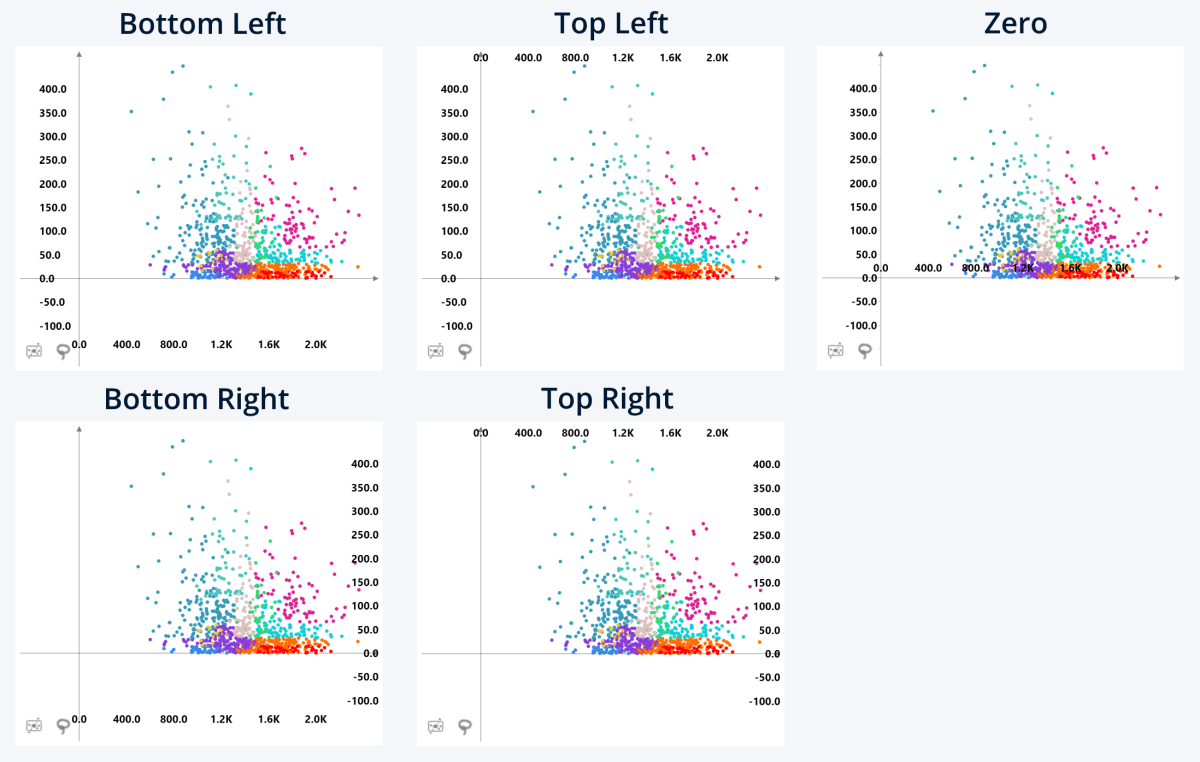
Select where the X-axis and Y-axis value labels are displayed.
- Bottom Left: displays the axis value labels near the left and bottom edges of the visual.
- Bottom Right: displays the axis value labels near the right and bottom edges of the visual.
- Top Left: displays the axis value labels near the left and top edges of the visual.
- Top Right: displays the axis value labels near the right and top edges of the visual.
- Zero: Displays the axis value labels on their corresponding axis lines or, when an axis is outside the visible area, at the nearest edge of the visual.
Was this helpful? Thank you for your feedback!
Sorry about that.
How can we improve it?