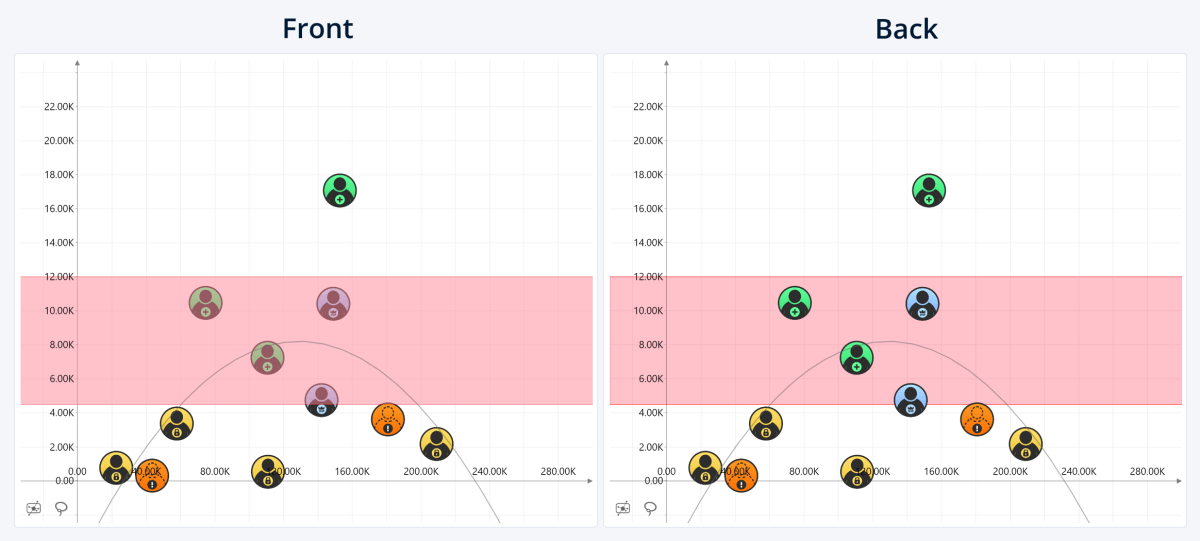
Choose how the selected threshold is layered in relation to the chart elements.
- Front: displays the threshold line or area on top of the chart elements.
- Back: displays the threshold line or area behind the chart elements.
Was this helpful? Thank you for your feedback!
Sorry about that.
How can we improve it?