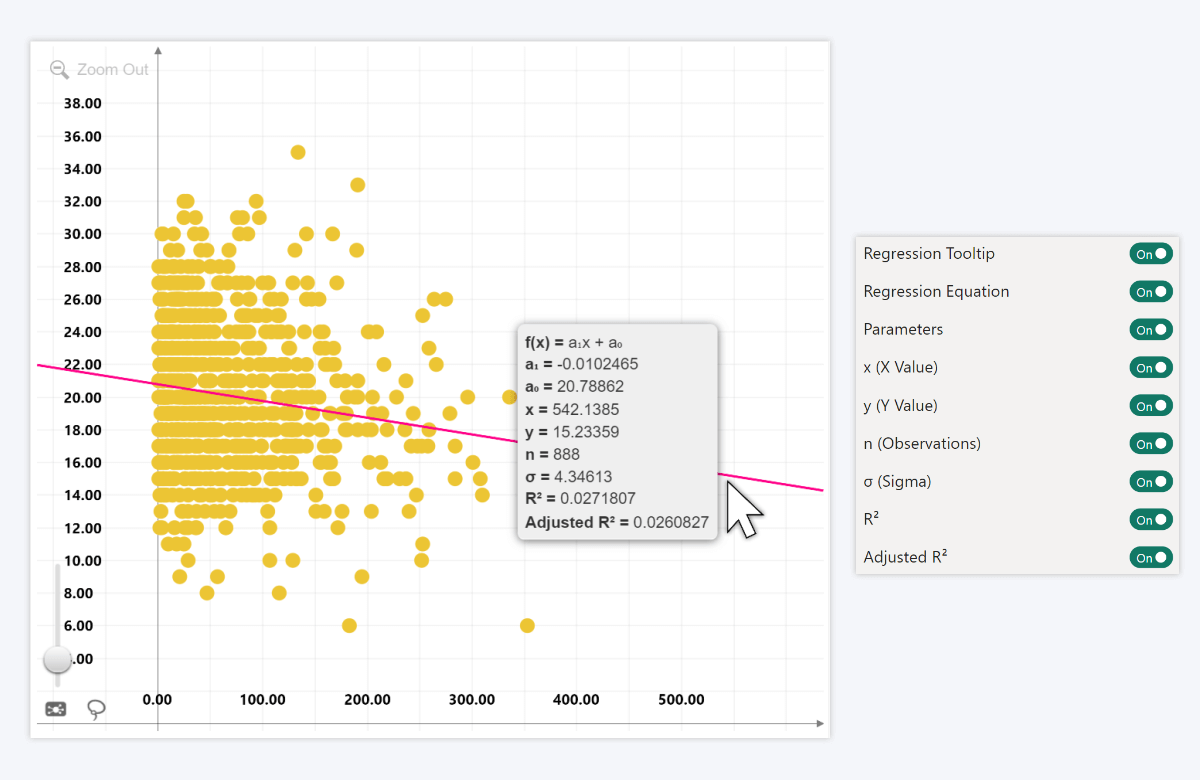
Enable this setting to display a tooltip when hovering over the regression line.
When enabled, you can choose which information is displayed in the tooltip::
- Regression Equation: displays the formula of the regression line.
- Parameters: displays the regression parameters (a0, a1, etc.).
- x (X Value): displays the x-coordinate at the current cursor position.
- y (Y Value): displays the y-coordinate at the current cursor position.
- n (Observations): displays the total number of data points used in the regression.
- σ (Sigma): displays the residual standard deviation of the regression.
- R2: displays the coefficient of determination.
- Adjusted R2: displays the adjusted coefficient of determination.
Was this helpful? Thank you for your feedback!
Sorry about that.
How can we improve it?