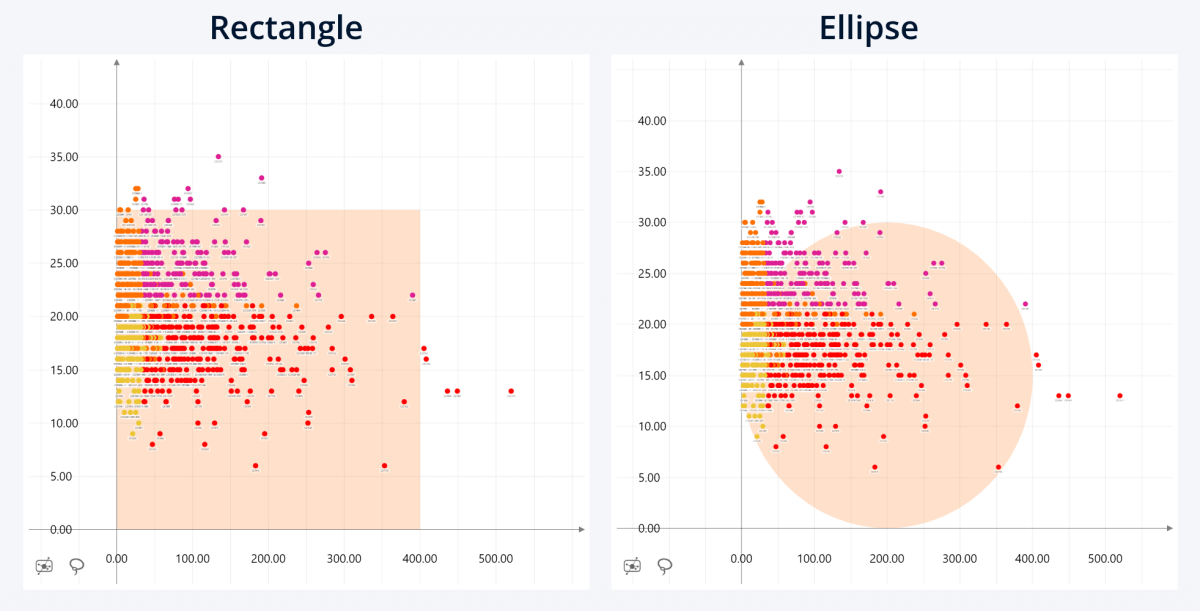
Choose the shape of the selected shaded area.
- Rectangle: displays the area as a rectangle. The X-Axis Start and X-Axis End settings determine its width, while Y-Axis Start and Y-Axis End determine its height. If any start or end position is set to Infinity, the rectangle extends across the entire chart in that direction
- Ellipse: displays the area as an ellipse. The X-Axis Start and X-Axis End settings define the horizontal axis of the ellipse, while Y-Axis Start and Y-Axis End define the vertical axis.
Was this helpful? Thank you for your feedback!
Sorry about that.
How can we improve it?