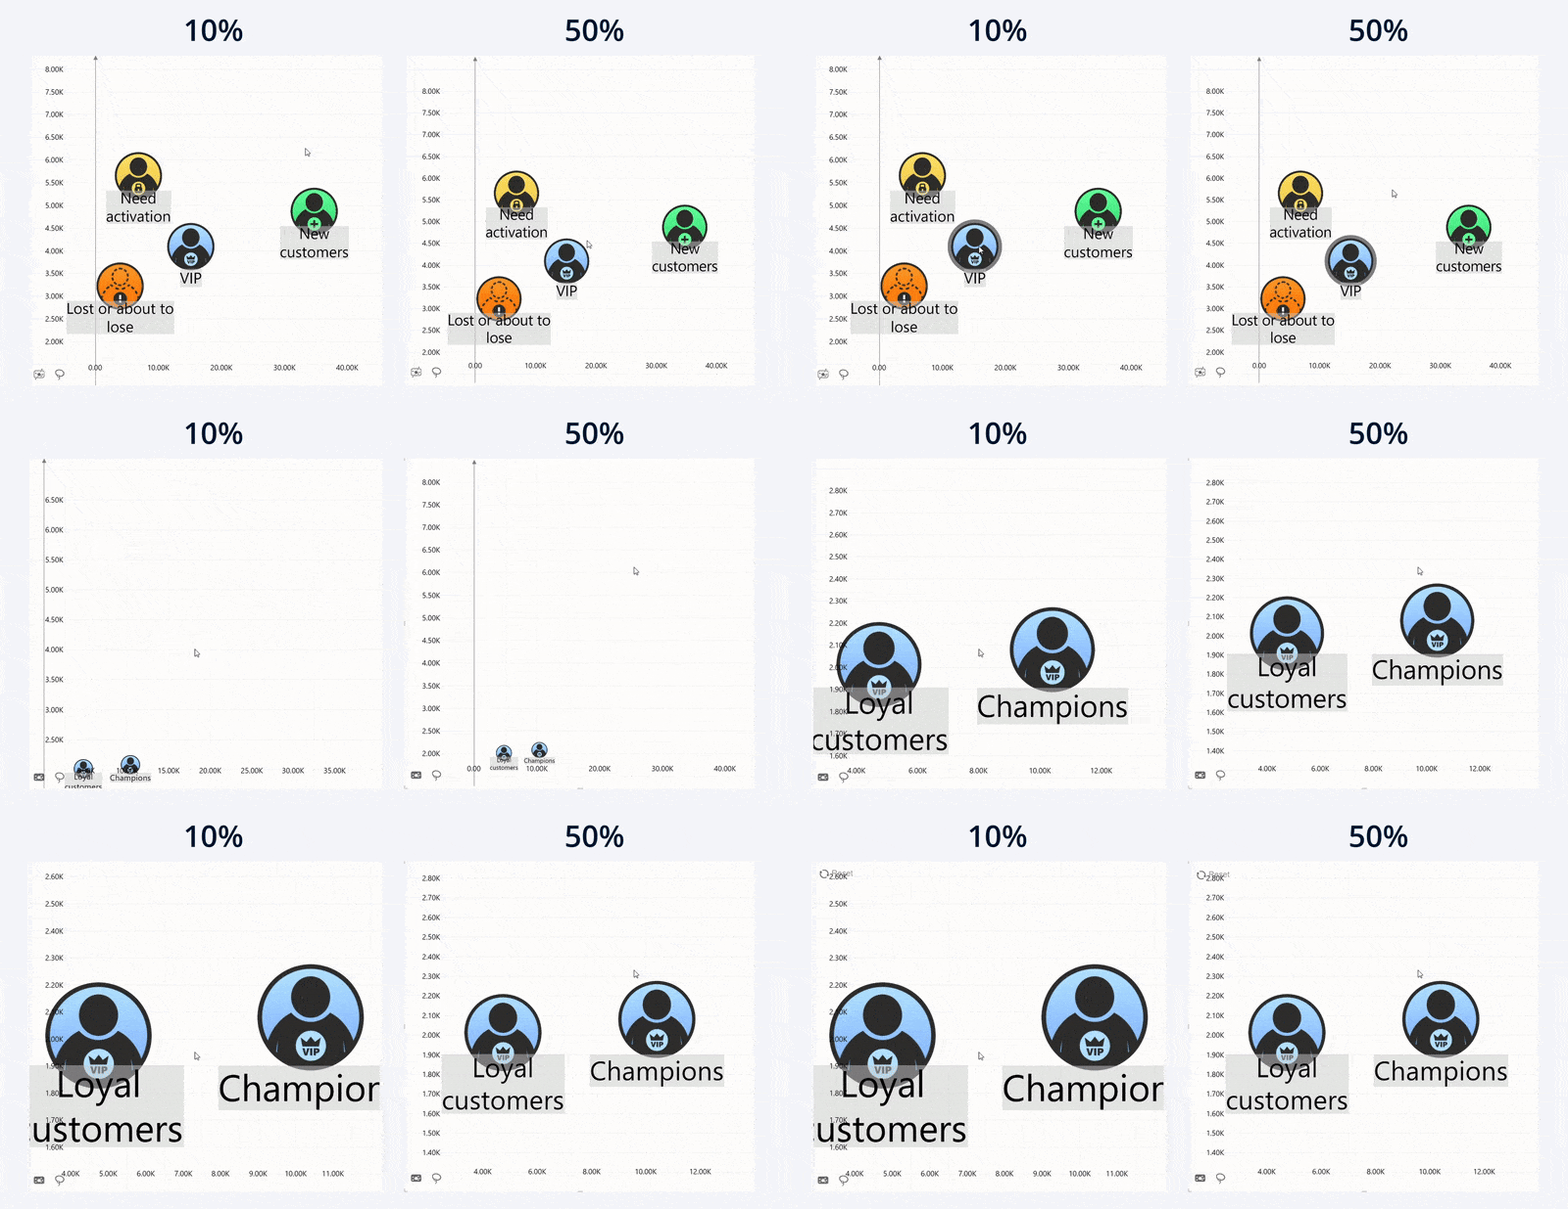
Set the minimum margin between data points and the edges of the chart area when the visual automatically adjusts the zoom level (for example, after drilling, filtering, or using Fit To Screen).
Enter a value between 0 and 100, where 0 applies no margin and 100 applies the largest margin. The default value is 10.
Increasing the margin helps prevent data points from overlapping the chart axes during automatic zooming.
Was this helpful? Thank you for your feedback!
Sorry about that.
How can we improve it?