Conditional Formatting
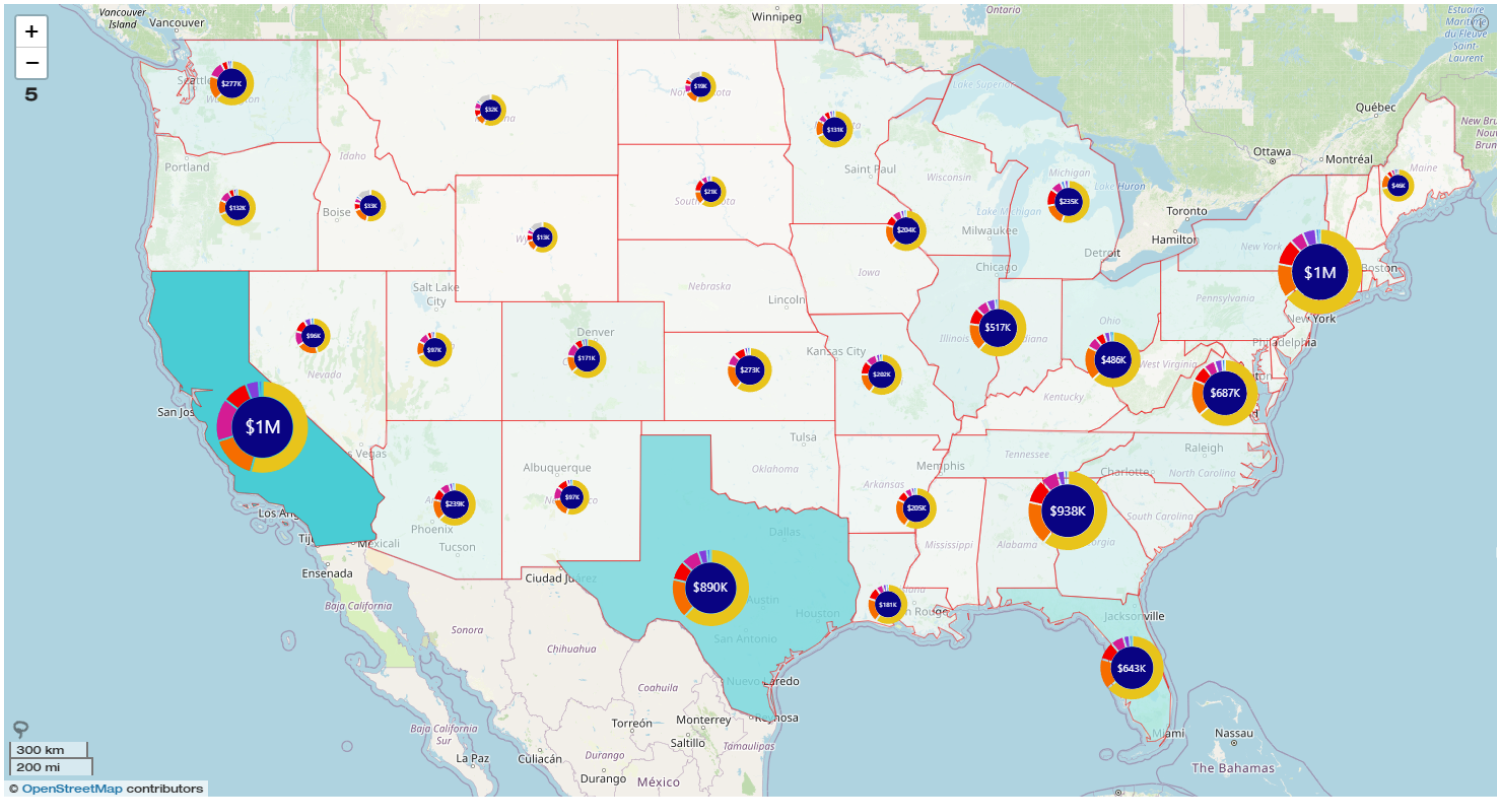
Use this toggle to enable conditional formatting for this shape layer. If conditional formatting is enabled, the visual will determine the fill color shade and fill opacity of each shape depending on the cumulative value of all data points (from the Value field) located within the shape.
This setting can be used to provide quick visual insights about location-specific data to the user, such as sales data, population density, incident/event frequency or other values. Conditional formatting can also be used to quickly create choropleth maps.
Once conditional formatting is enabled, additional customization settings will be revealed:
- Use Reference Value: Apply conditional formatting rules based on the shape value’s proximity to its own Reference Value. Available if you have added valid data to the Reference Value field.
- Value Aggregation*: Choose the aggregation method of all Values within each shape.
- Reference Value Aggregation*: Choose the aggregation method of all Reference Values within each shape.
- Min Fill Color: Fill color that will be applied to the shape with the lowest total value.
- Min Fill Opacity: Fill opacity level that will be applied to the shape with the lowest total value.
- Reference Value Color*: Fill color that will be applied to shapes with values that match their Reference Values. If the value is below the reference value, it will be blended with Min Fill Color, but if it exceeds the reference value, it will be blended with Max Fill Color.
- Reference Value Opacity*: Fill color opacity that will be applied to shapes with values that match their Reference Values.
- Max Fill Color: Fill color that will be applied to the shape with the highest total value.
- Max Fill Opacity: Fill opacity level that will be applied to the shape with the highest total value.
- Treat Empty Shapes as Min: Choose if conditional formatting is applied to shapes that contain no values.
- Color Scale*: Choose between absolute or relative scale when using reference values.
Was this helpful? Thank you for your feedback!
Sorry about that.
How can we improve it?
