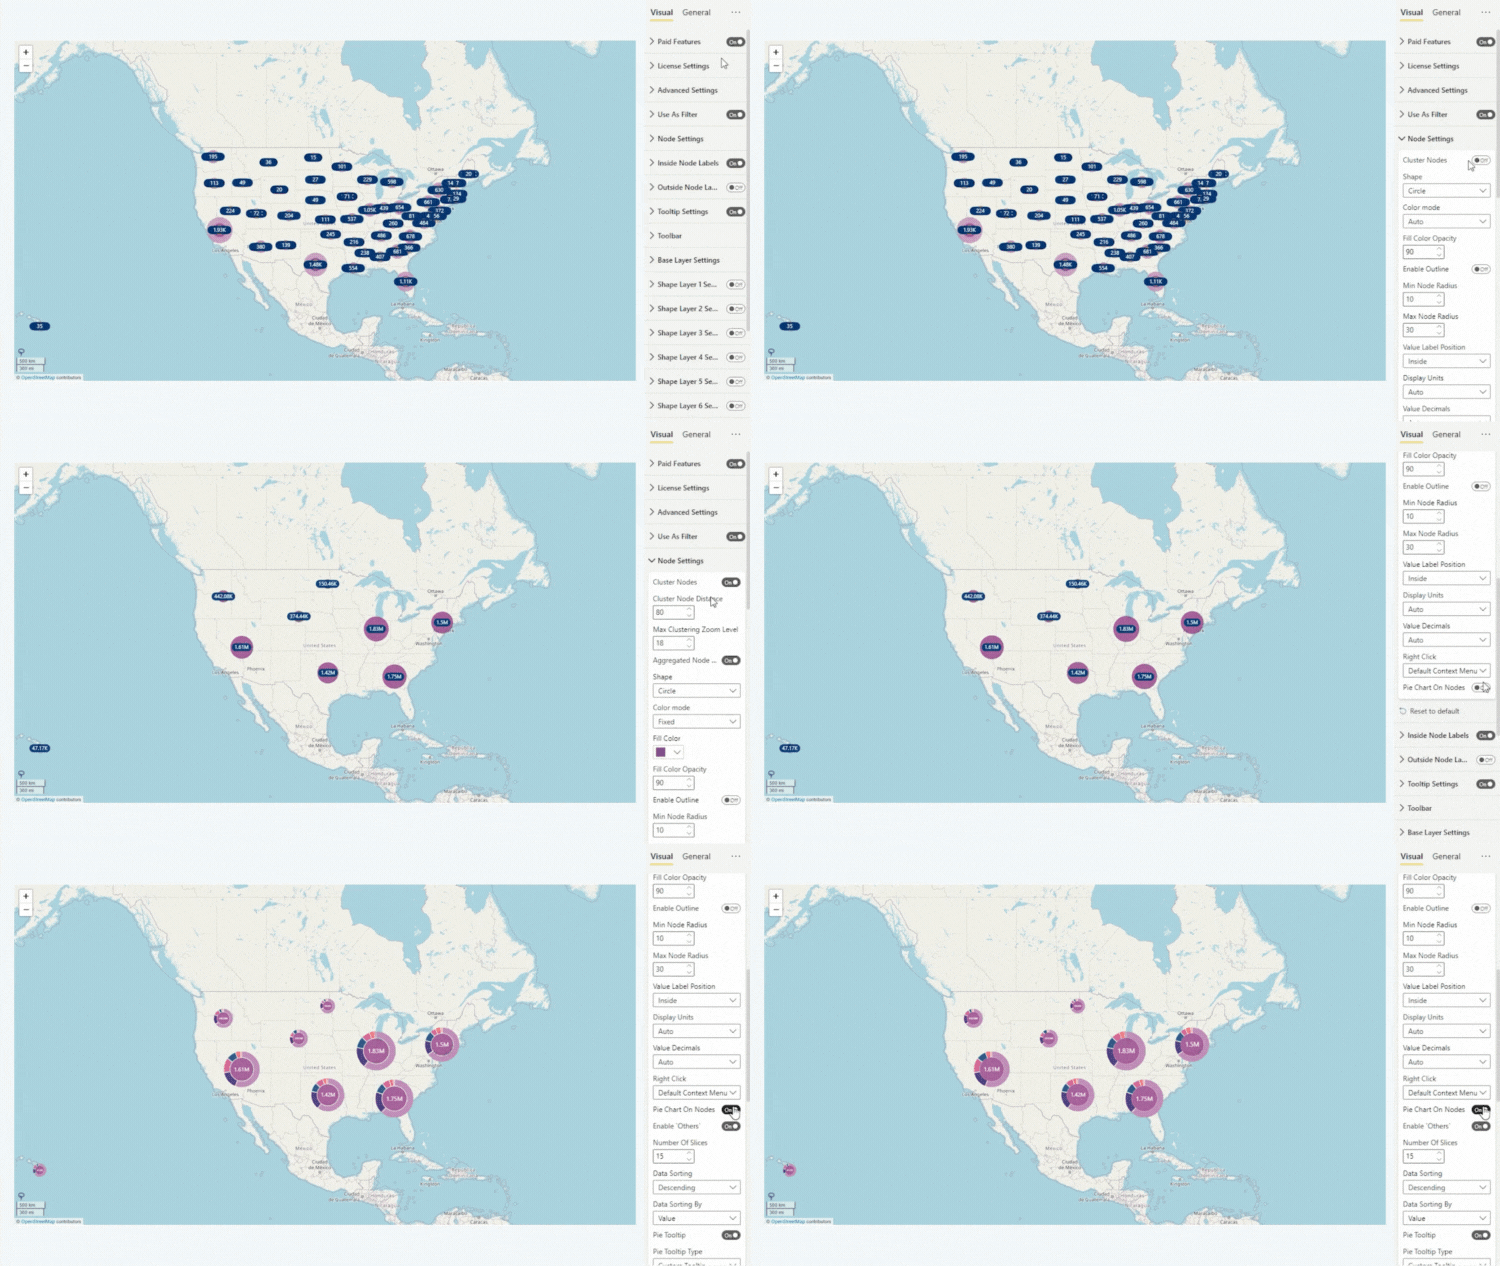
Node Clustering
If you have too many data points and you want to declutter your map and increase readability, you can enable Cluster Nodes. This feature will combine multiple nearby data points and display them as large nodes with aggregated values.
This way, you can provide a clean and easily readable overview at the initial zoom level, while expanding into more detail and displaying all the individual nodes as the user zooms in.
Finetune the cluster node behavior with additional settings – Cluster Node Distance to adjust the area of effect, and Max Clustering Zoom Level to choose the zoom level at which all cluster nodes expand into individual data points.
You can even display the cluster node values as a donut chart directly on the map by enabling the Pie Charts on Nodes toggle.

Was this helpful? Thank you for your feedback!
Sorry about that.
How can we improve it?