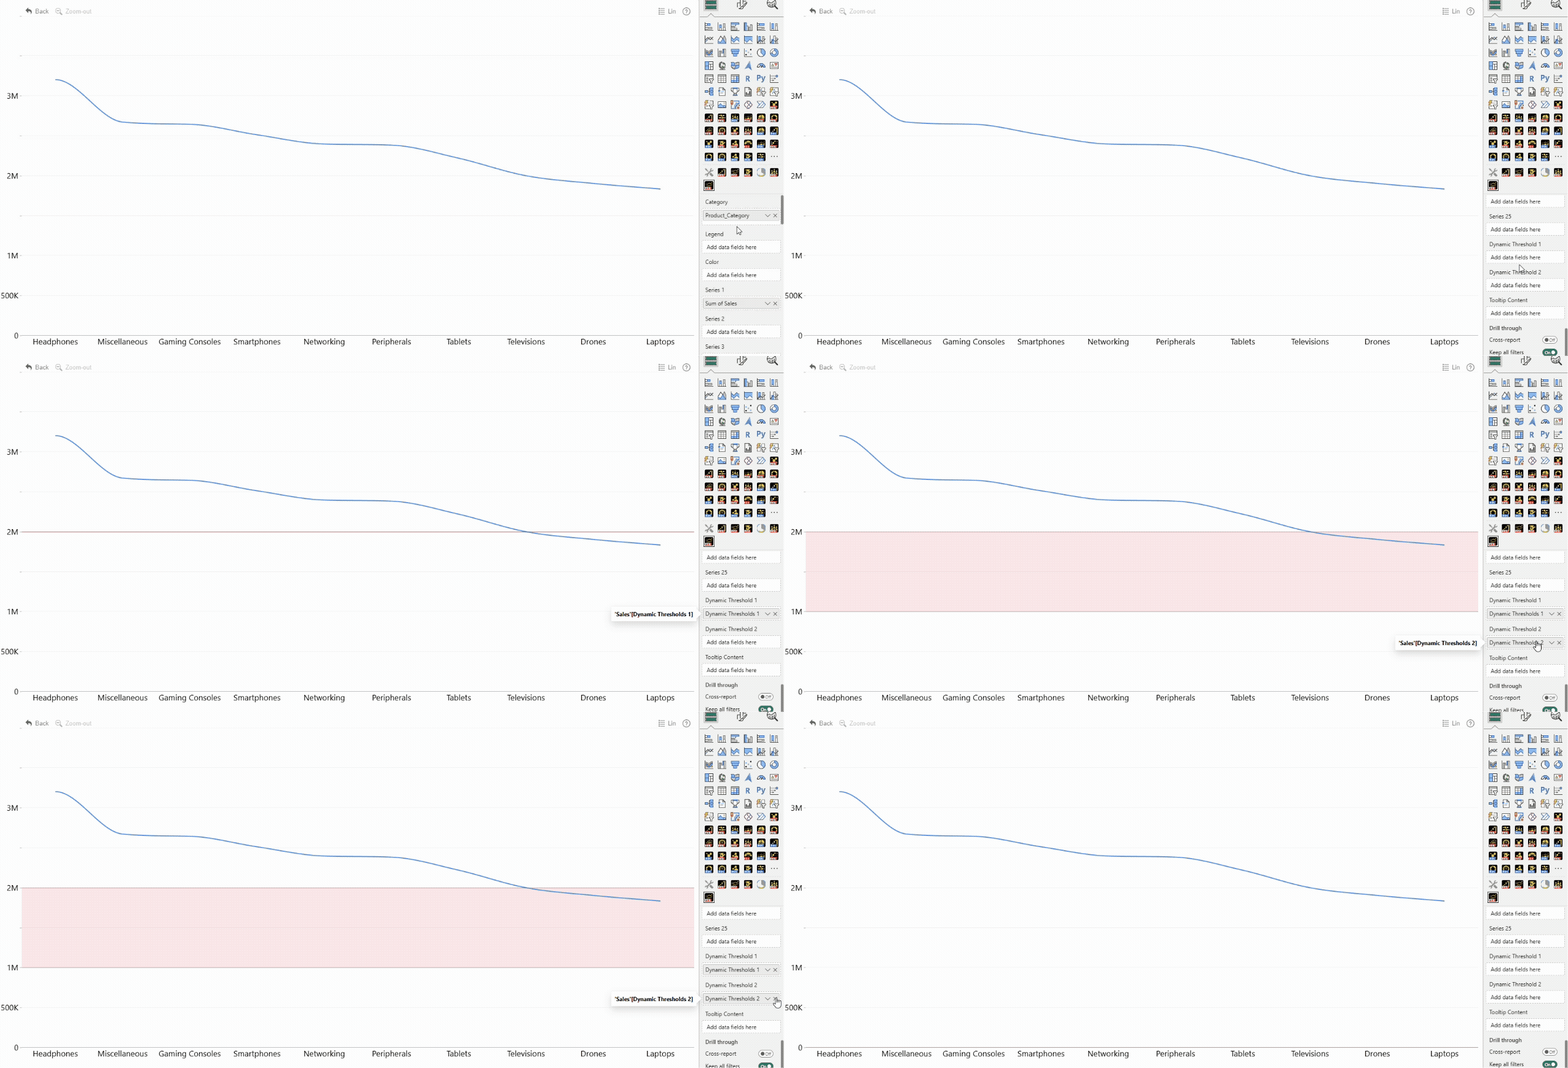
Add optional numerical fields or measures to Dynamic Threshold 1 and Dynamic Threshold 2 to define threshold values dynamically from your data.
You can add up to two dynamic thresholds. When a field or measure is added, the corresponding threshold is automatically enabled in the visual.
Dynamic thresholds can be used to highlight value ranges, compare series values against limits, or indicate important boundaries in the chart.
Was this helpful? Thank you for your feedback!
Sorry about that.
How can we improve it?