Drill Down Line PRO lets you visualize and compare up to 25 data series as lines in a single chart. Each series can be customized independently, allowing you to explore trends and compare numerical values across categories.
You can also create a drill-down hierarchy to explore your data at different levels of detail.

Before you begin
To create a line chart, add categorical data to Category and numerical data to at least one Series field.
The Category field defines the data points displayed on the X-axis. Add multiple fields from the highest hierarchy level to the lowest to create a drill-down hierarchy. For example, add Region, followed by Country and City.
Add each numerical measure to a separate Series field. The values determine the position of the corresponding line along the Y-axis.
Each Series field supports one numerical measure. Drill Down Line PRO supports up to 25 series, each of which can be customized independently.
Additional fields are optional and provide further customization options. For more information, see the Data Fields page.
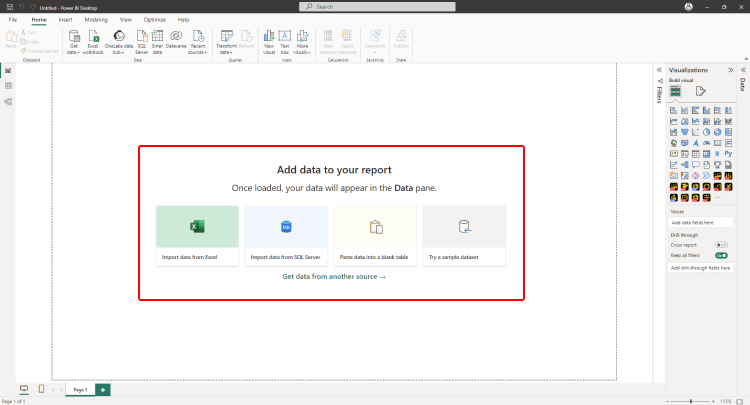
Initial Setup
Drill Down Line PRO includes a guided setup experience that helps you start with a common chart configuration.
To add Drill Down Line PRO to your Power BI report, select the visual in the Visualizations pane.
You will be presented with several chart configurations. Select the configuration you want to create
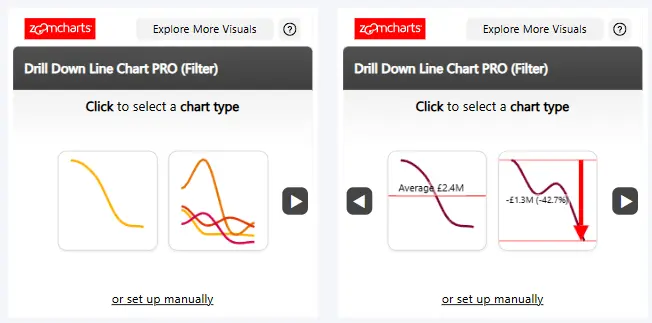
Required Fields Guidance
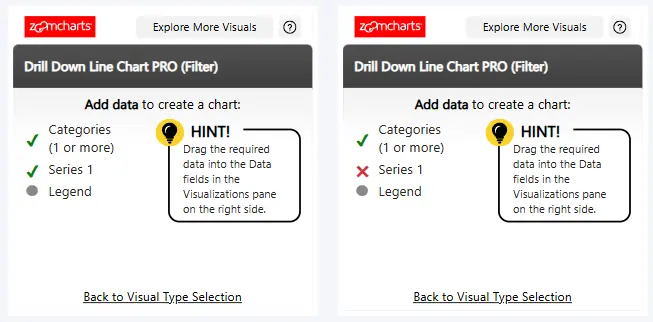
After you select a configuration, the visual displays the data fields required to create it.
Field Validation and Visual Generation
As you add data, the visual indicates which required fields have been provided and whether the assigned data is valid. Once all required fields contain valid data, the chart is generated. You can then customize it further in the Format visual pane.
Manual Setup
To configure the visual without selecting a predefined configuration, select Manual Setup at the bottom of the initial setup window.
Was this helpful? Thank you for your feedback!
Sorry about that.
How can we improve it?