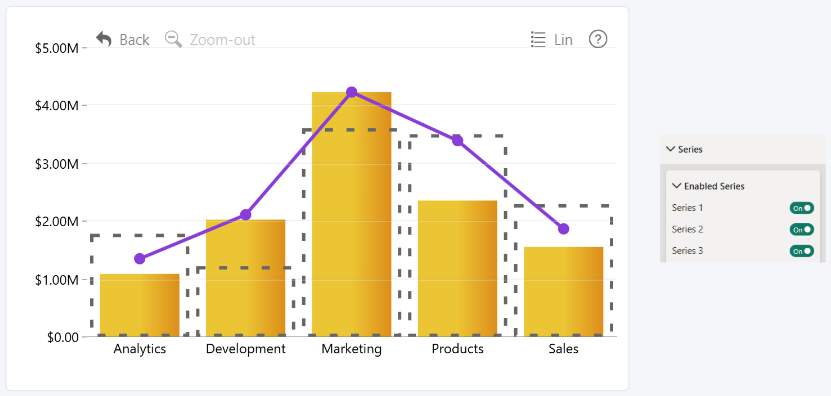
Use Enabled Series to show or hide individual chart series.
Each series has its own On/Off toggle. Disabling a series hides it from the chart without removing its assigned data field.
The available series depend on the data assigned to the visual.
Was this helpful? Thank you for your feedback!
Sorry about that.
How can we improve it?