2533
Supply Chain Power BI Dashboard Example
Supply Chain Power BI Dashboard Example
More Report pages
Report Author: ZoomCharts
2533
Share template with others
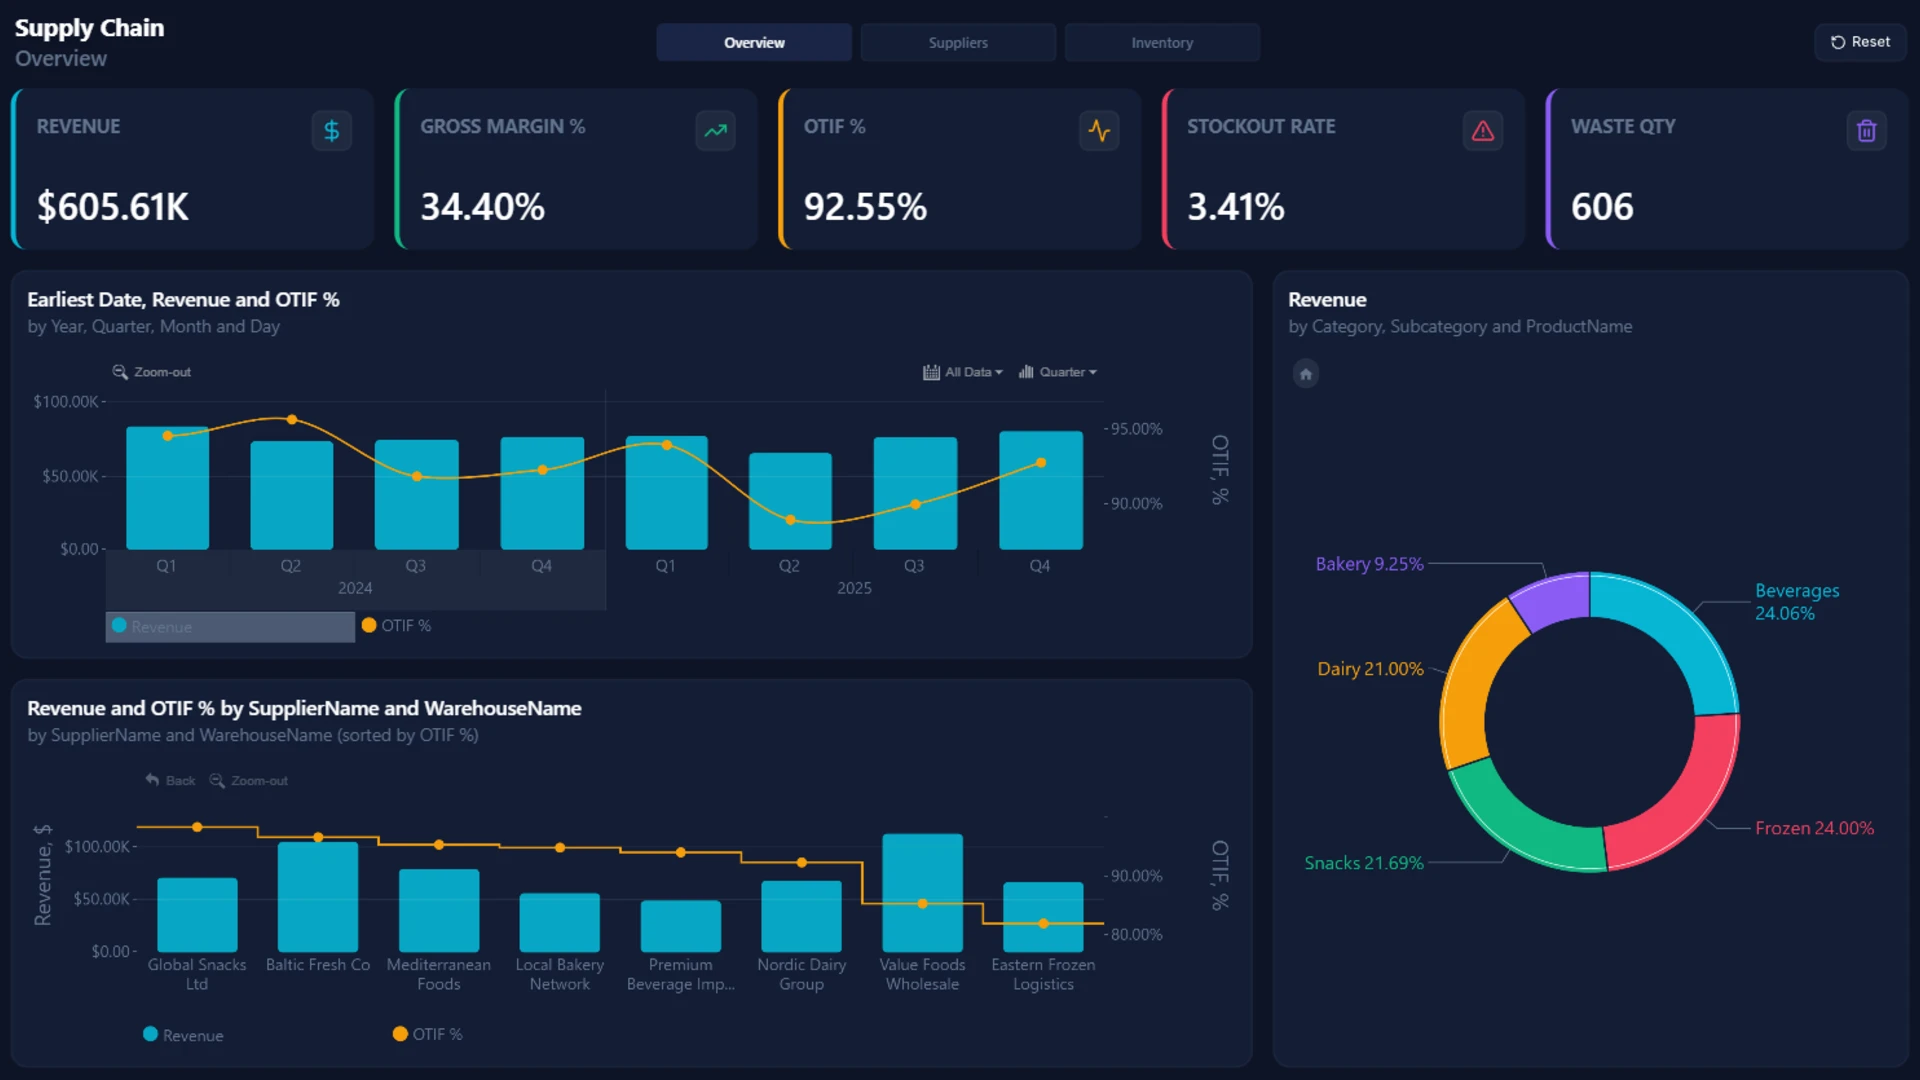
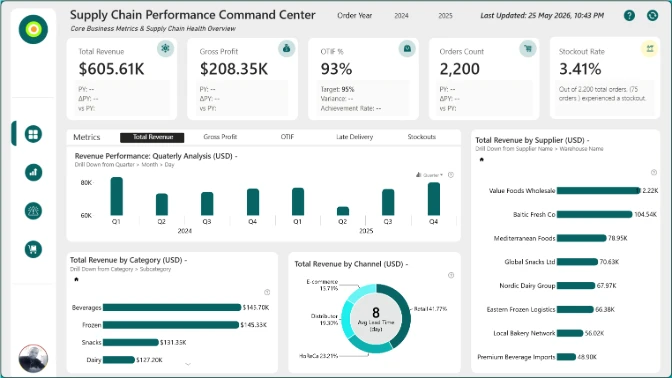
This Supply Chain Power BI Dashboard is a professional end-to-end analytics solution designed to help businesses monitor inventory performance, supplier efficiency, stockout risks, OTIF metrics, waste reduction, and revenue optimization in one interactive report.
The report includes multiple analytical views:
- Supply Chain Overview Dashboard
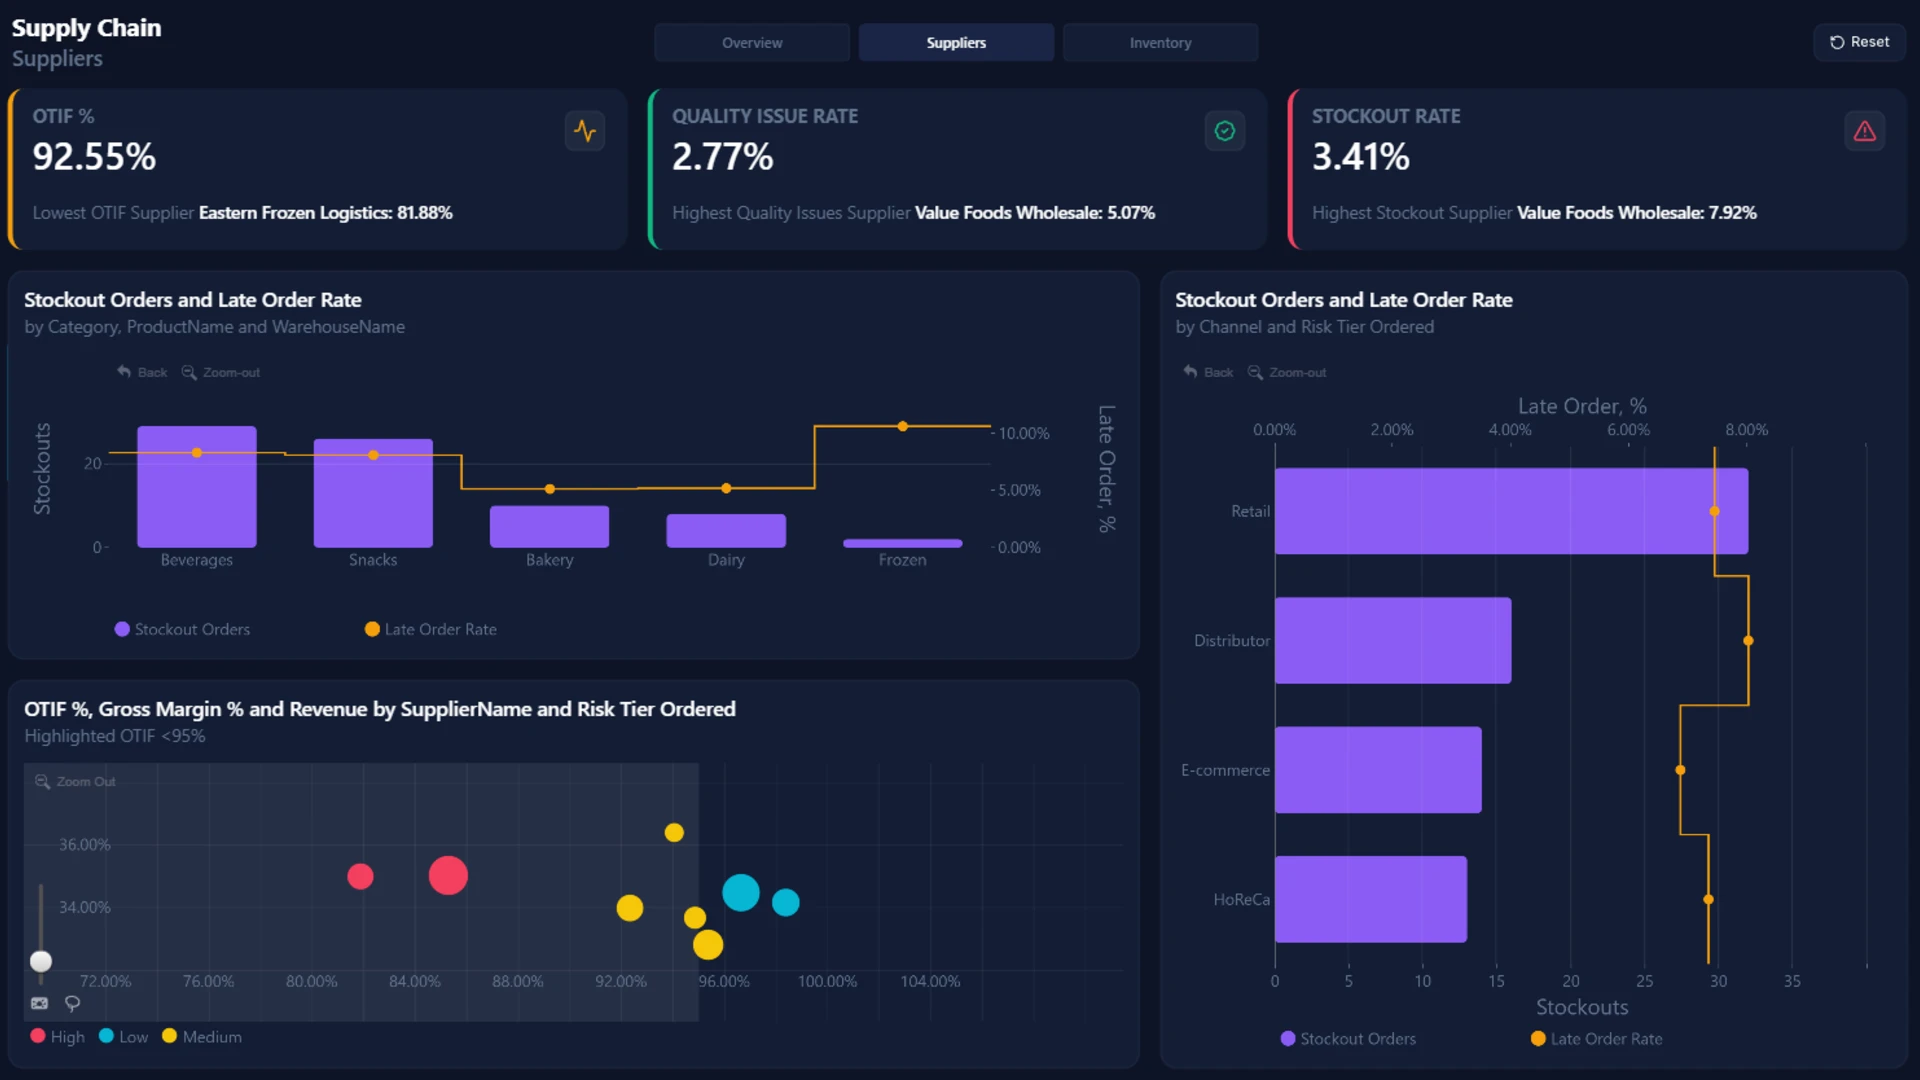
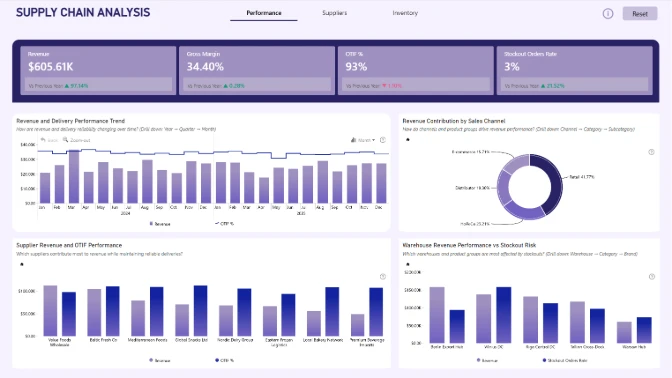
- Supplier Performance Analytics
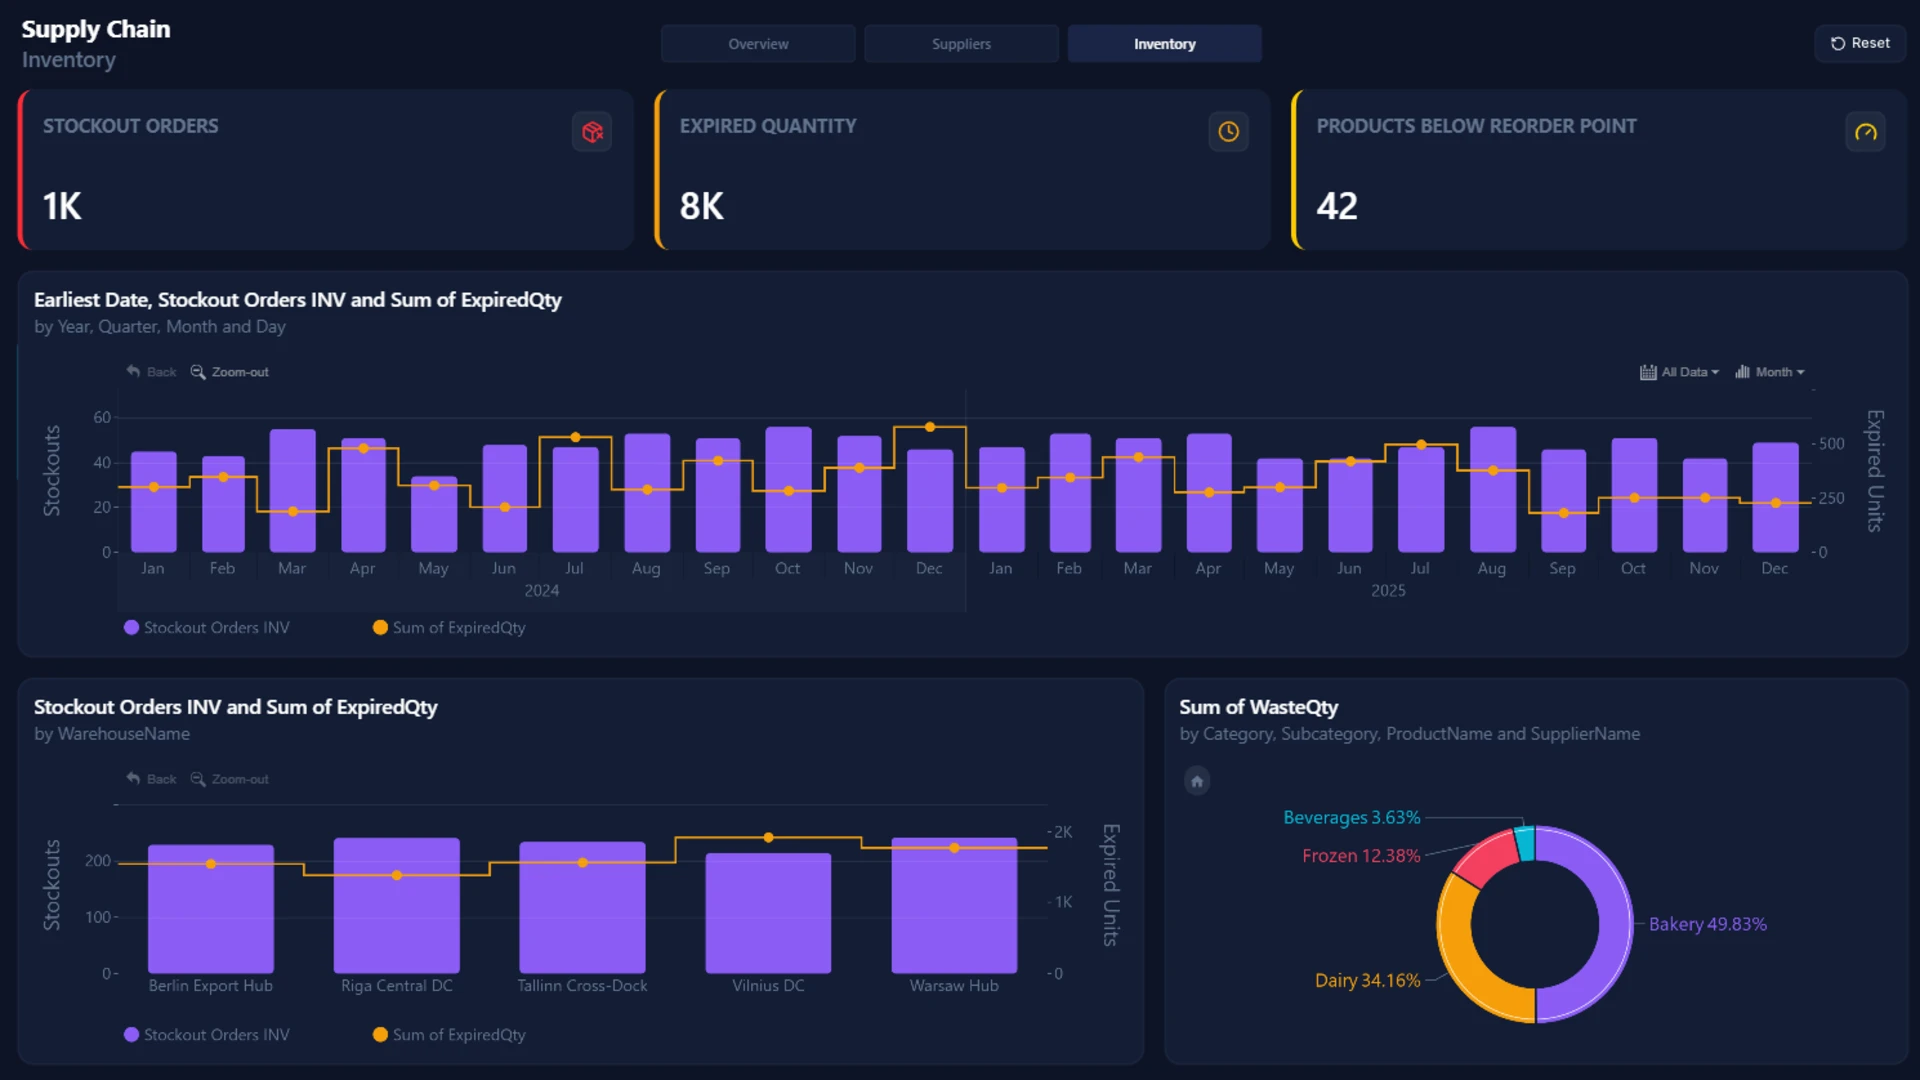
- Inventory & Stockout Monitoring
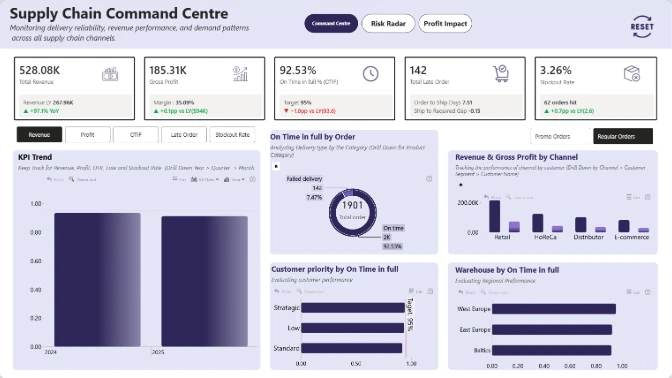
- Revenue & Gross Margin Analysis
- Waste & Expired Product Tracking
- OTIF (On-Time In-Full) KPI Monitoring
- Risk Tier & Channel Performance Analysis
Designed for high usability and fast business decision-making, this template follows the IBCS-inspired 4U Reporting Principles:
- Unified – consistent design, colors, and KPI logic
- Unambiguous – clear visual hierarchy and easy-to-read metrics
- Useful – focused on actionable supply chain KPIs
- User-Friendly – intuitive navigation with drill down interactions
Visuals used in this dashboard
This dashboard showcases powerful interactive visuals from ZoomCharts together with native Power BI KPI cards and filtering components to create a seamless analytical experience.
Users can seamlessly drill down from yearly trends to monthly and daily analysis, explore supplier and warehouse performance, and identify operational bottlenecks with advanced cross-filtering interactions.
Key supply chain KPIs included
- Revenue
- Gross Margin %
- OTIF %
- Stockout Rate
- Waste Quantity
- Expired Inventory
- Supplier Risk Analysis
- Late Order Rate
- Inventory Reorder Monitoring
- Warehouse Performance
Why this Power BI Supply Chain Dashboard stands out
This Power BI dashboard example is ideal for companies looking to:
- Improve supply chain visibility
- Reduce stockouts and inventory waste
- Optimize supplier performance
- Increase operational efficiency
- Build executive-ready Power BI reports
- Learn modern dashboard design best practices
Whether you are searching for:
- Supply Chain Power BI Dashboard Examples
- Inventory Management Power BI Reports
- Logistics Analytics Dashboards
- Procurement KPI Dashboards
- Interactive Power BI Templates
- Power BI Dashboard Design Inspiration
this template provides a modern, scalable, and visually engaging reporting solution.
Perfect for:
- Supply Chain Managers
- Operations Teams
- Procurement Analysts
- Inventory Controllers
- Logistics Companies
- Power BI Developers
- Data Analysts
This Power BI supply chain report template is fully customizable and works with your own data. It is a great starting point for building a dashboard.
Author:ZC
ZoomCharts visuals used
4U Report Challenges
Participate in data challenges, build and submit reports to get free template downloads.
Join CommunityMobile view allows you to interact with the report. To Download the template please switch to desktop view.
Was this helpful? Thank you for your feedback!
Sorry about that.
How can we improve it?