13781
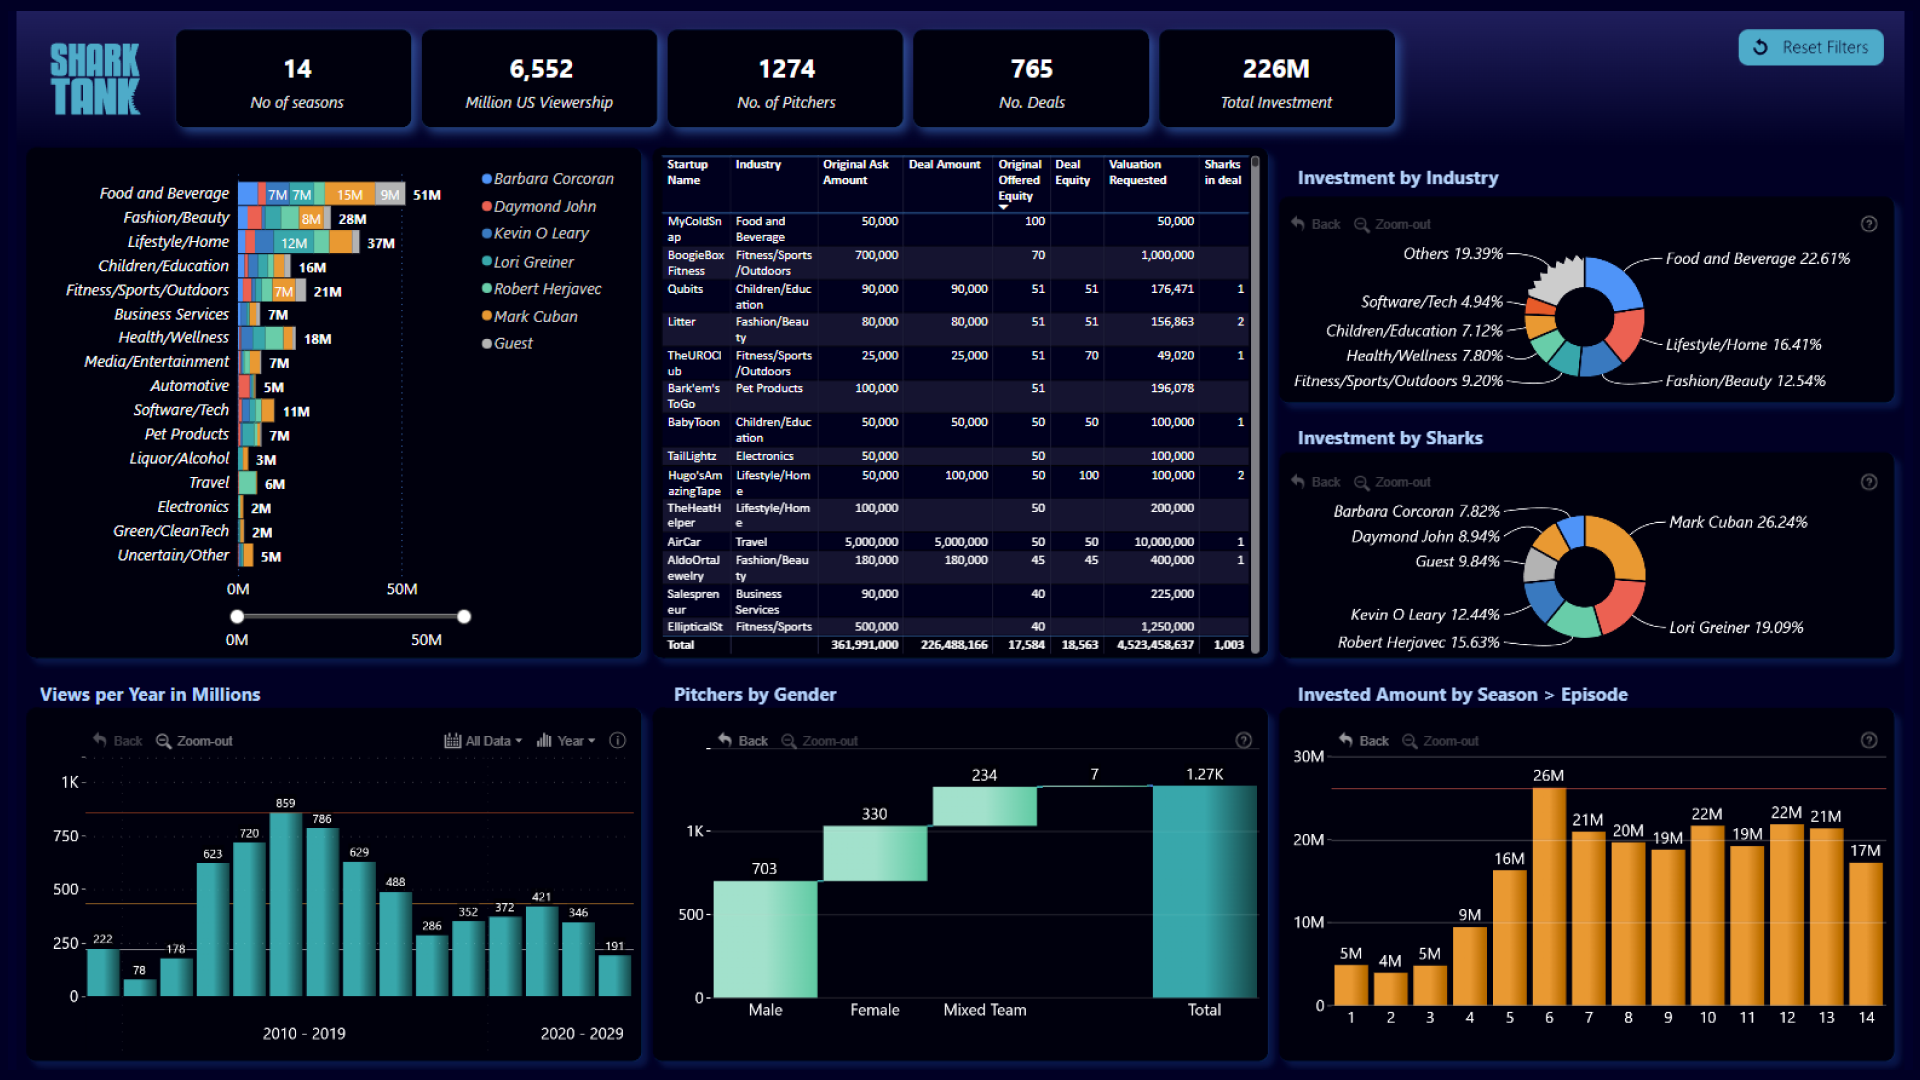
Shark Tank Analysis by Vanessa Florez
Shark Tank Analysis by Vanessa Florez
Report Author: Vanessa Florez
13781
Share template with others
Summary
This Power BI report is based on one of the top entries for ZoomCharts Mini Challenge, September 2023, which was hosted in collaboration with Onyx Data. The challenge dataset was based on the popular TV show Shark Tank US.
The report has been reviewed by ZoomCharts team and enhanced with ZoomCharts custom Drill Down PRO visuals to showcase the ease of use and features such as on-chart interactions and cross-chart filtering, resulting in a more user-friendly experience.
See the original report submitted by the author here.
How To Use This Report Template
To interact with this Power BI report, simply click any active elements directly on the charts.
Download this report to see all the settings, formulas, and calculations. Try it out with your own data by making a few adjustments.
ZoomCharts visuals used




4U Report Challenges
Participate in data challenges, build and submit reports to get free template downloads.
Join CommunityMobile view allows you to interact with the report. To Download the template please switch to desktop view.



How to use a PBIX template
Preview the interactive report, download the PBIX file, open it in Power BI Desktop, and replace the same data connection with your own dataset.
Preview and download
Explore the report online and download the PBIX template file.
Open in Power BI Desktop
Open the downloaded PBIX file in Power BI Desktop.
Connect your data
Replace the sample data source with your own dataset.
Refresh and adjust
Refresh the model and update fields or visual were needed.
Save and share
Save your report and publish it for your audience.


