768
Sales Pipeline & Deals Analytics Report 5
Sales Pipeline & Deals Analytics Report 5
Report Author: yasmeen amjad
768
Share template with others
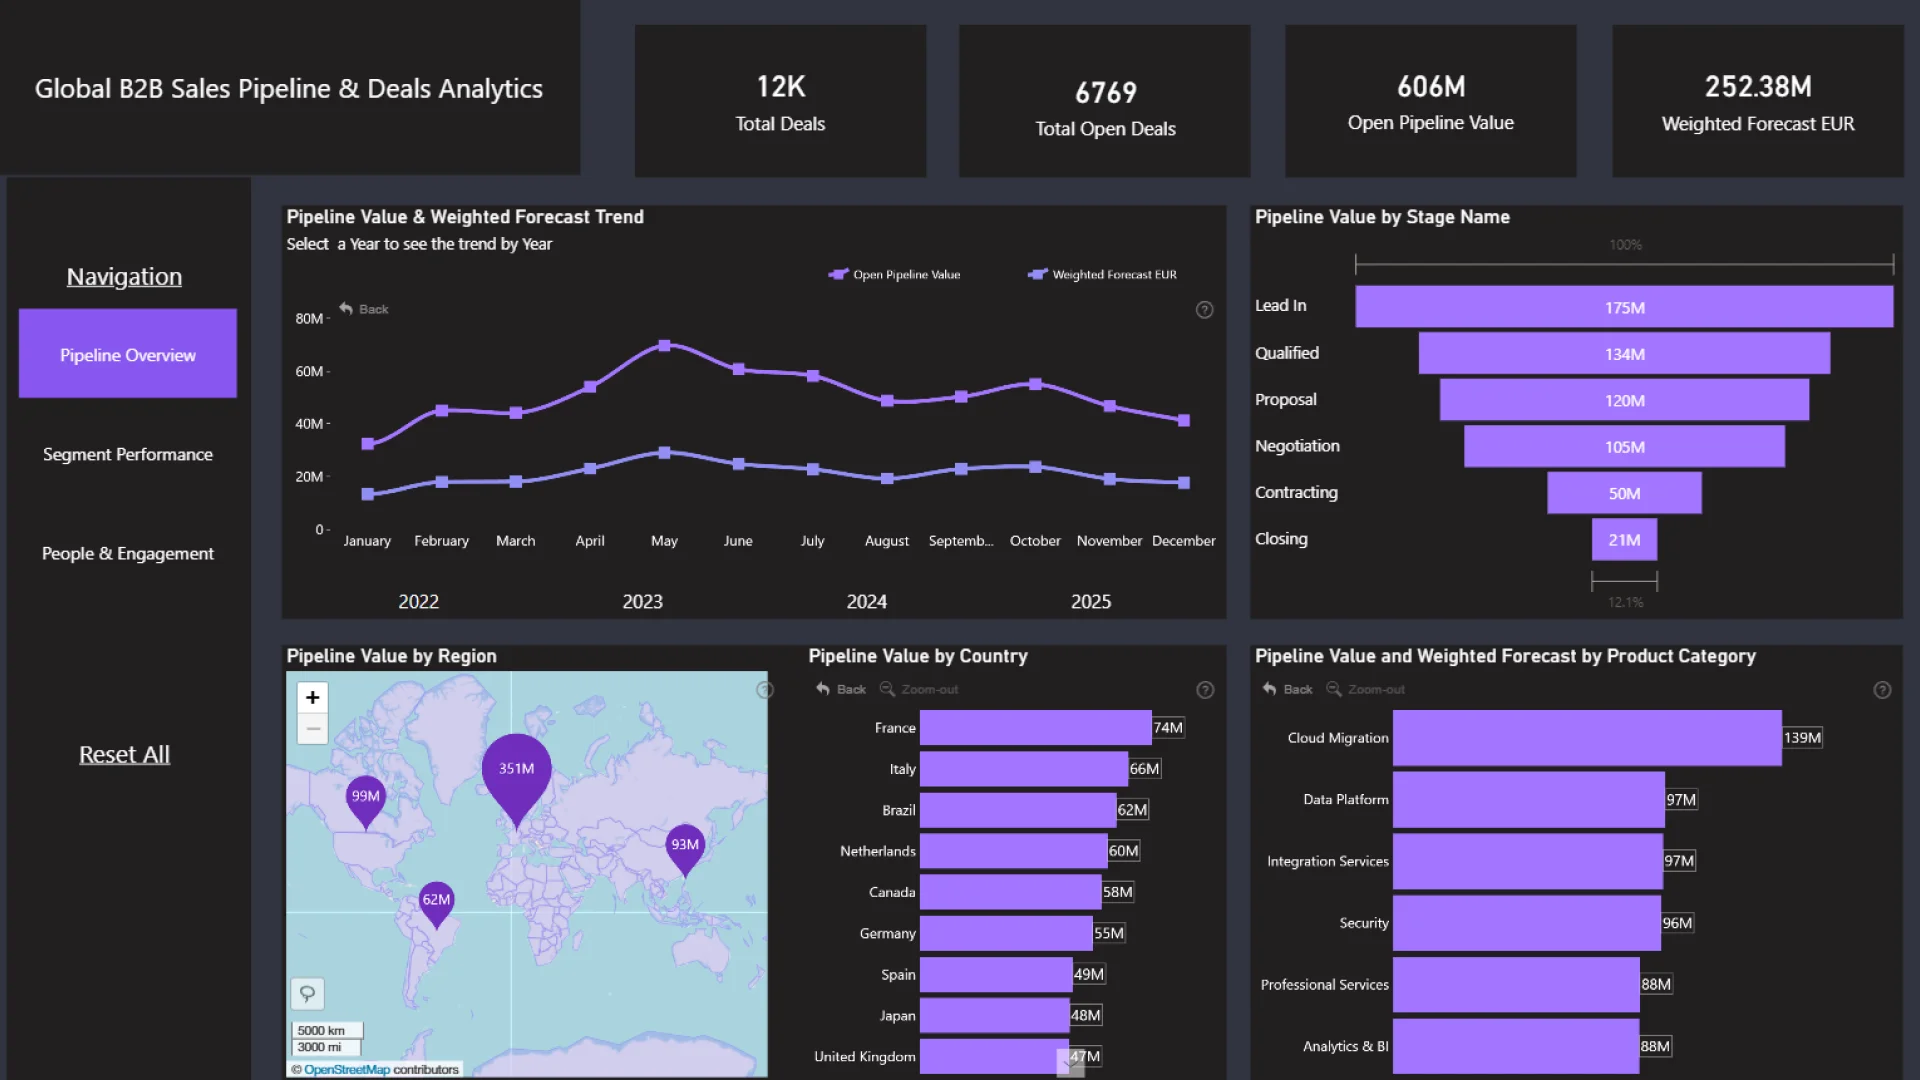
This interactive Power BI report explores the Global B2B Sales Pipeline & Deals Analytics dataset using ZoomCharts Drill Down PRO custom visuals for Power BI. It highlights pipeline value, deal progression, sales activity, and client engagement across regions and industries, helping teams monitor pipeline health and identify stalled or high-risk deals.
The report was submitted to the FP20 Analytics ZoomCharts Data Challenge #35 (February – March 2026).
Author’s Description:
This project focuses on building a Power BI dashboard to analyze the sales pipeline and sales activities. The report combines deal data and activity data to provide a complete view of how sales opportunities progress through different stages.
Key metrics such as total deal value, win probability, deal status, and activity types are analyzed to better understand sales performance. The report enables stakeholders to explore insights by sales representative, product category, company, region, and time period.
ZoomCharts visuals used
4U Report Challenges
Participate in data challenges, build and submit reports to get free template downloads.
Join CommunityMobile view allows you to interact with the report. To Download the template please switch to desktop view.

Was this helpful? Thank you for your feedback!
Sorry about that.
How can we improve it?