761
Real Estate Listings & Pricing Explorer
Real Estate Listings & Pricing Explorer
Report Author: Nina Ikpe
761
Share template with others
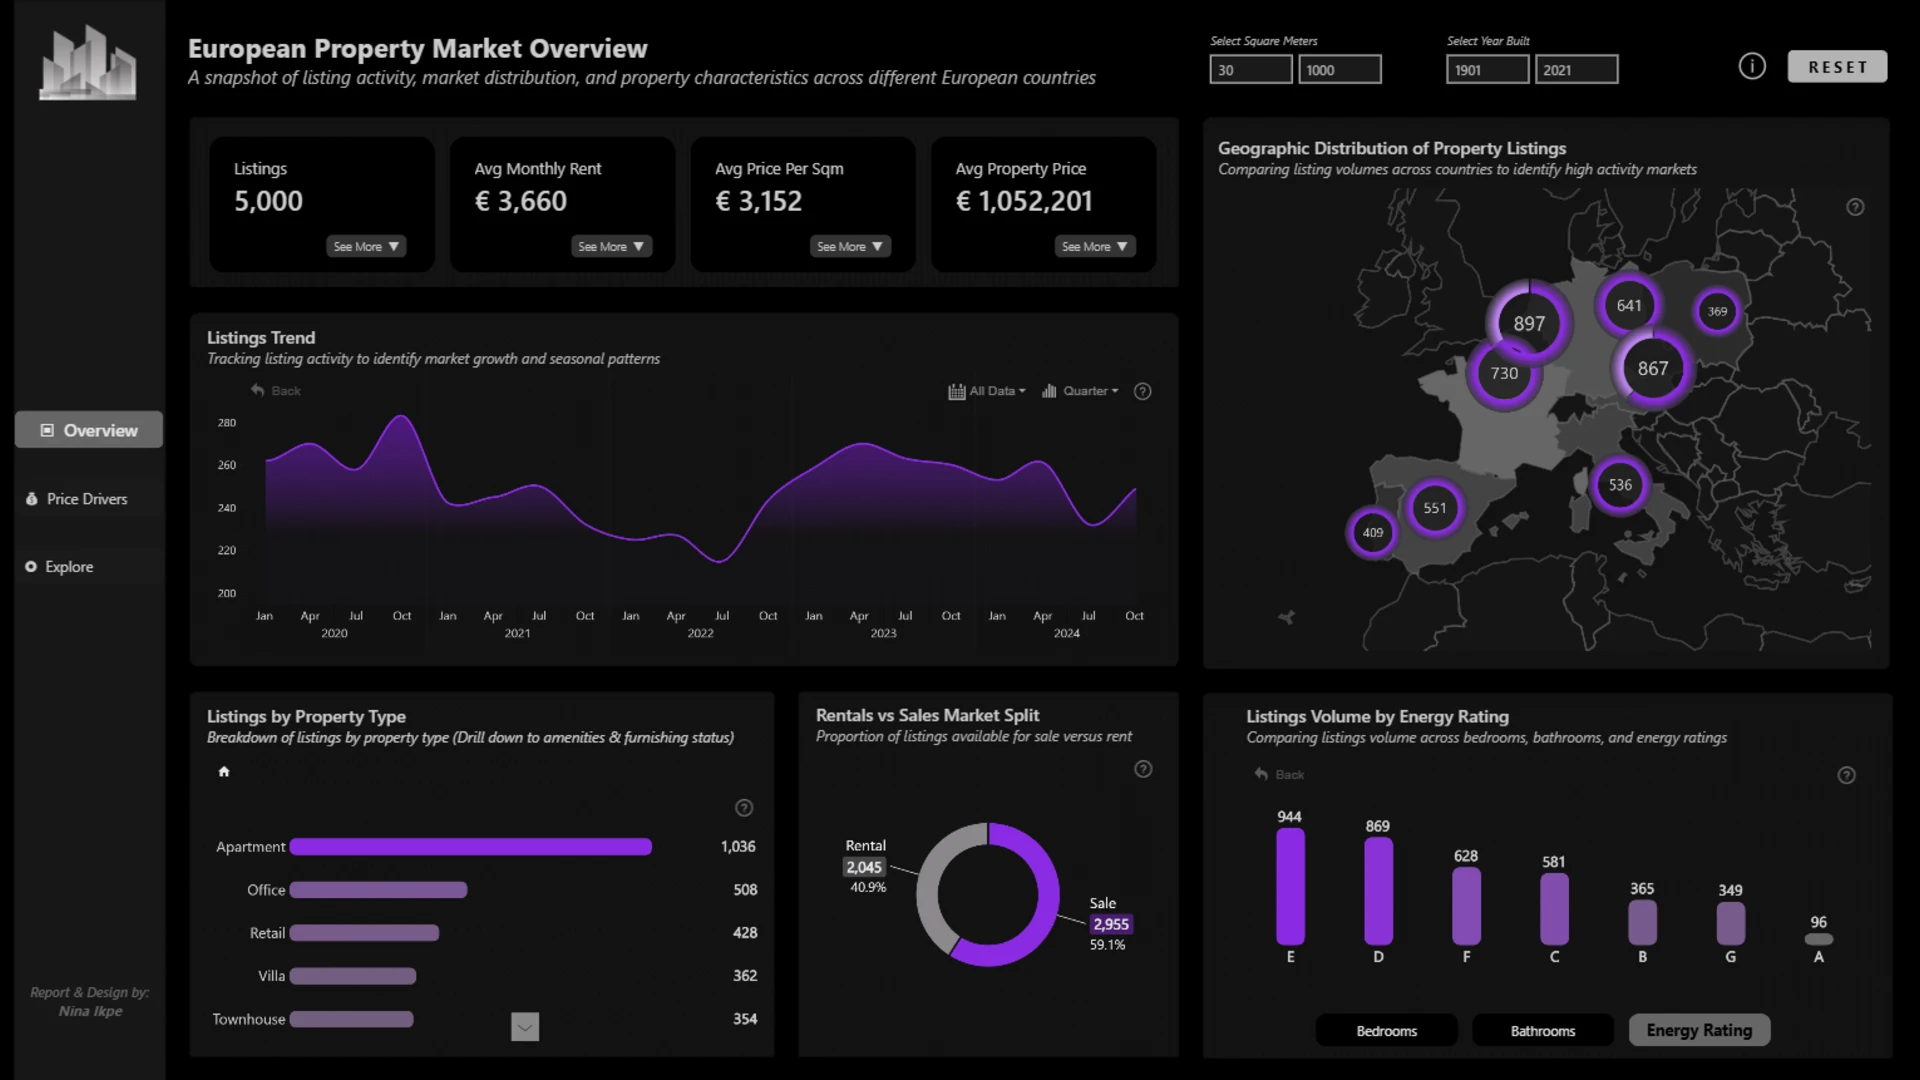
This interactive Power BI report explores the European Real Estate Market Analytics dataset using ZoomCharts Drill Down custom visuals for Power BI. It highlights property prices, price per square meter, listing activity, and property characteristics across countries and cities, helping users identify market trends, compare locations, and evaluate investment opportunities.
The report was submitted to the FP20 Analytics ZoomCharts Data Challenge #36 (March – April 2026).
Author’s Description:
From market trends to individual listings, this report gives you a clear, intuitive view of the real estate landscape. Start with a high-level overview of market activity, supply vs. demand, and key property trends across countries. Then explore what drives property value-from amenities and furnishing to size, energy efficiency, and layout. Finally, browse and compare individual listings in a clean, card-style view to quickly spot opportunities. Together, these pages help you understand the market, evaluate value, and take informed action.
ZoomCharts visuals used
Need help?
Send your question to ZoomCharts assistant, and we will respond to you as soon as possible.
Contact UsMobile view allows you to interact with the report. To Download the template please switch to desktop view.


Was this helpful? Thank you for your feedback!
Sorry about that.
How can we improve it?