535
Real Estate Listings & Pricing Explorer 3
Real Estate Listings & Pricing Explorer 3
More Report pages
Report Author: Philani Xulu
535
Share template with others
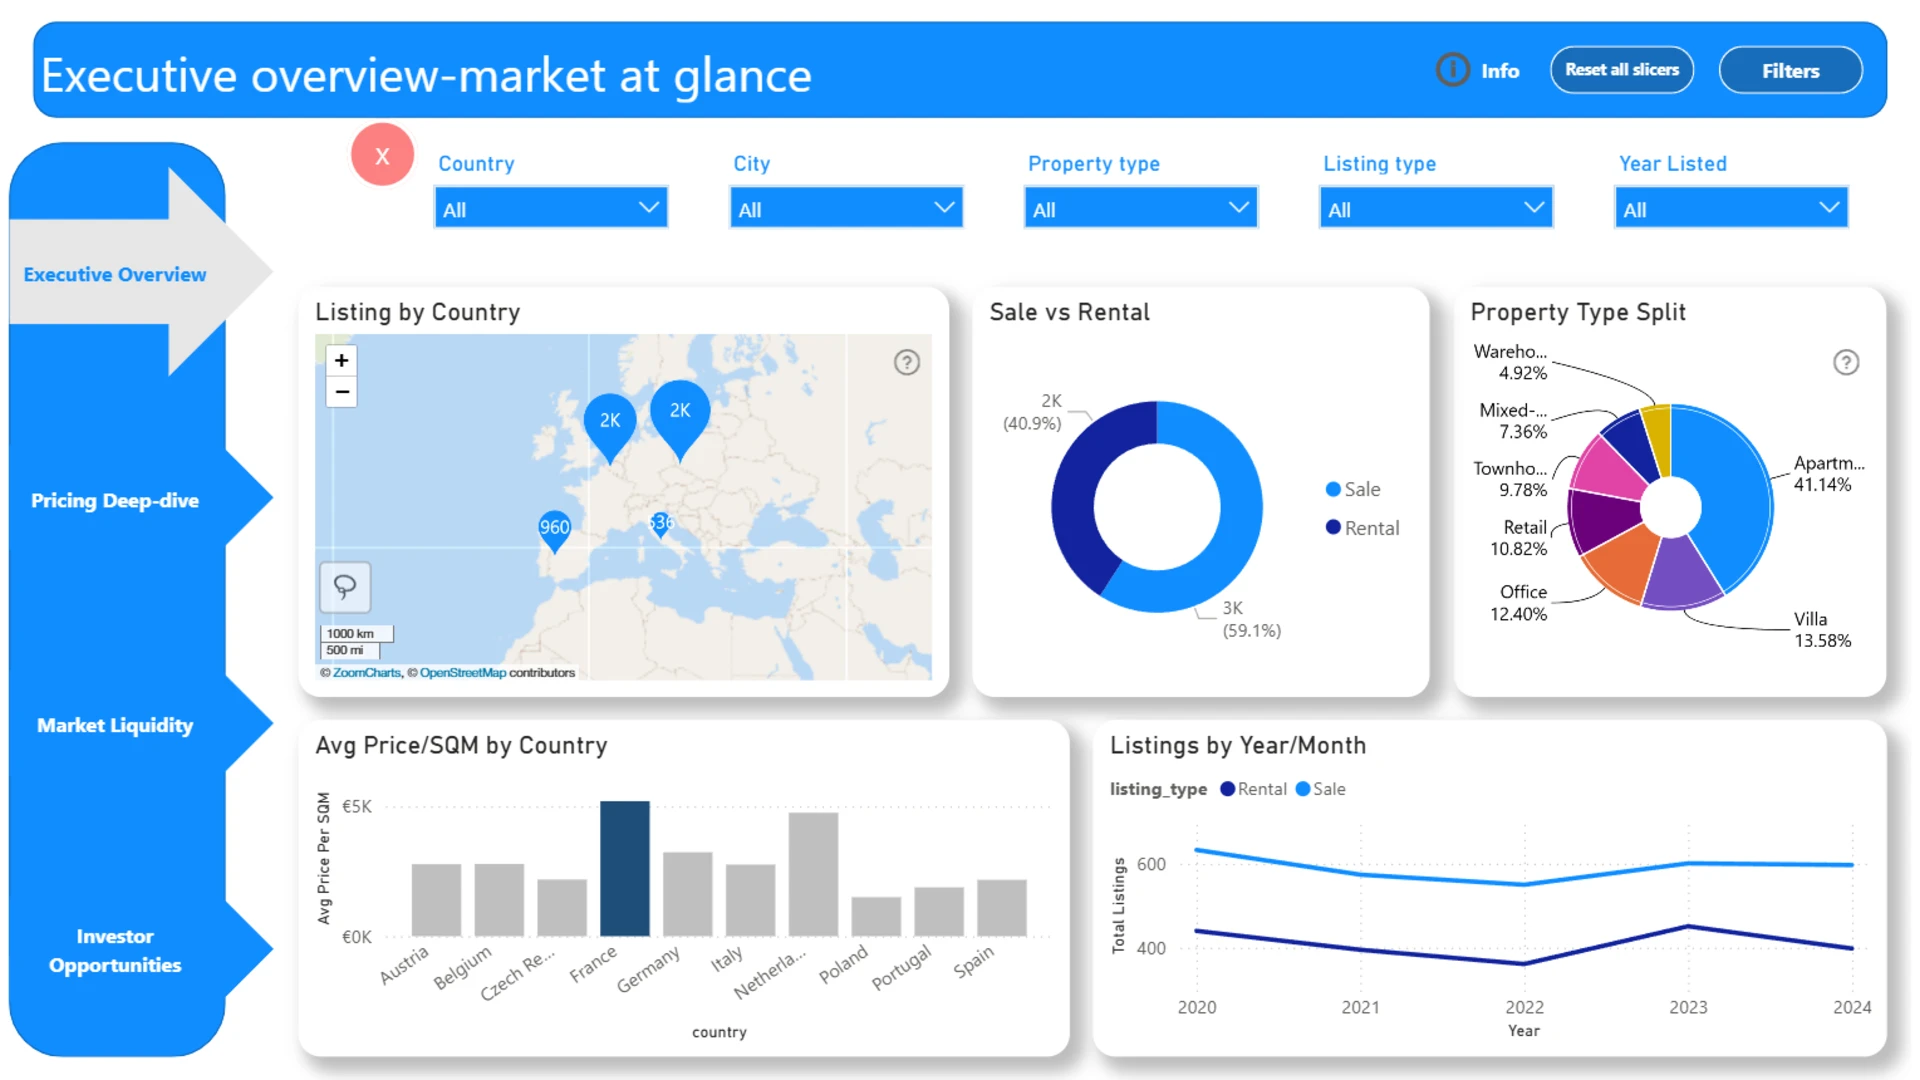
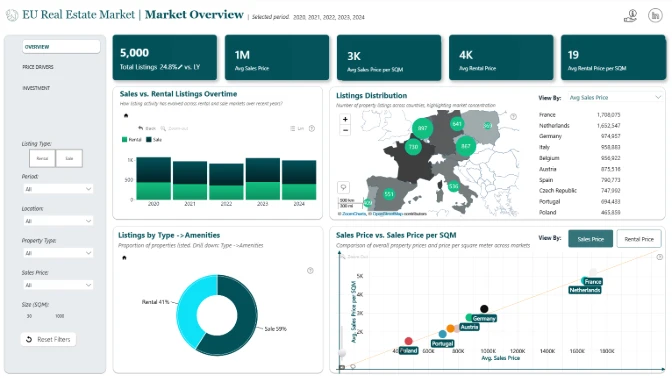
This interactive Power BI report explores the European Real Estate Market Analytics dataset using ZoomCharts Drill Down custom visuals for Power BI. It highlights property prices, price per square meter, listing activity, and property characteristics across countries and cities, helping users identify market trends, compare locations, and evaluate investment opportunities.
The report was submitted to the FP20 Analytics ZoomCharts Data Challenge #36 (March – April 2026).
Author’s Description:
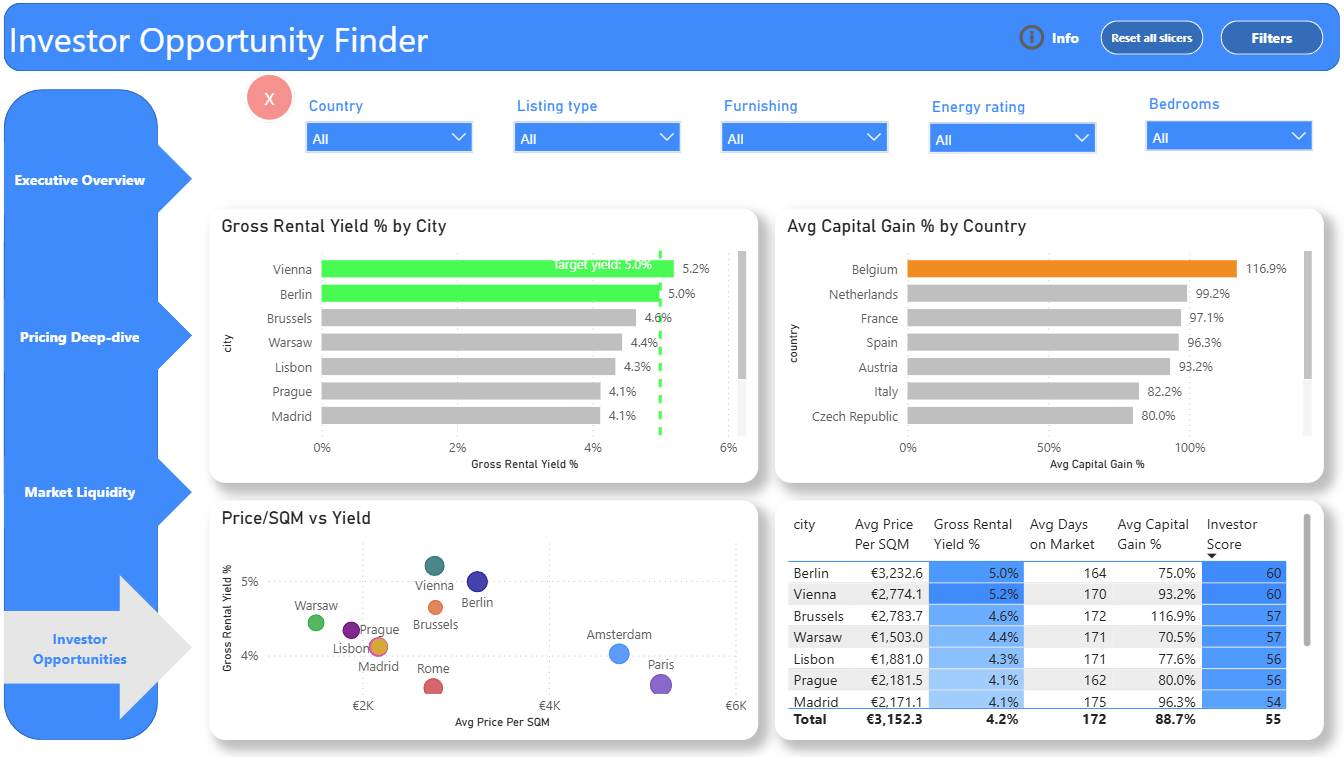
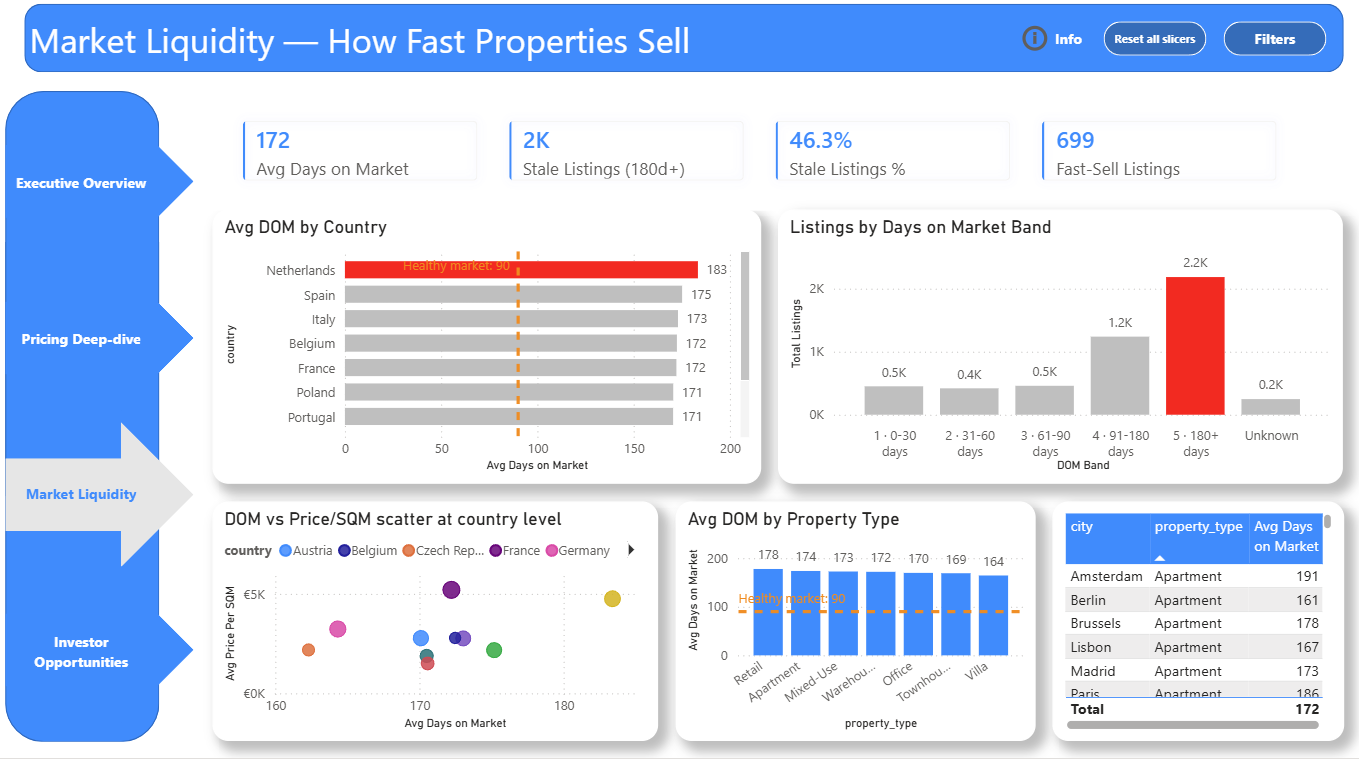
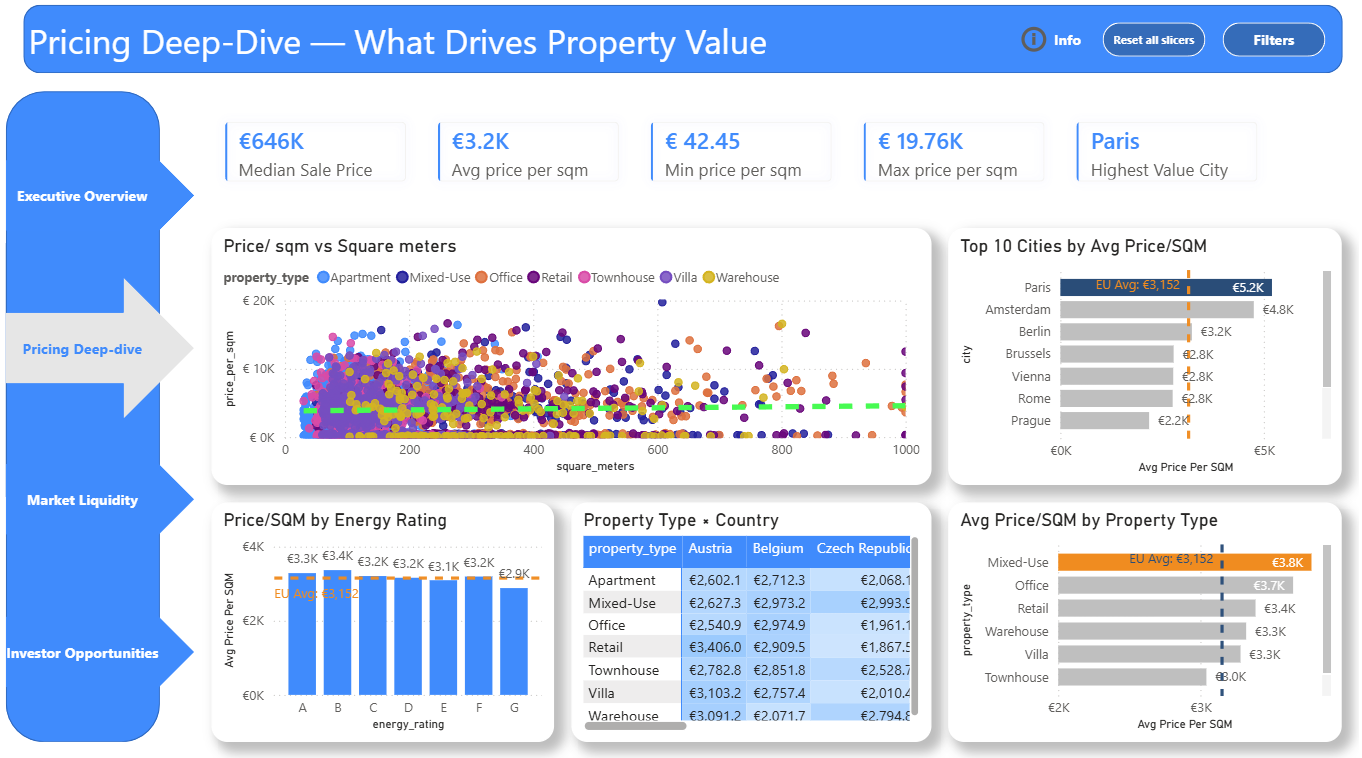
This report analyzes 5,000 EU property listings across 10 countries and 10 major cities. It was built to help real estate investors, analysts, and marketplace teams make data-driven decisions. The report spans four pages, covering market overview, pricing drivers, market liquidity, and investor opportunities.
Key findings include: France and the Netherlands commanding prices three times higher than Poland; nearly half of all listings remaining stale at 180+ days; and Belgium delivering 117% capital gains since the last sale. Warsaw and Prague emerge as the top investor value plays, offering affordable entry prices with consistent rental yields.
The report was built using DAX measures, ZoomCharts visuals, bookmarks for filter navigation, and a star schema data model.
4U Report Challenges
Participate in data challenges, build and submit reports to get free template downloads.
Join CommunityMobile view allows you to interact with the report. To Download the template please switch to desktop view.


Was this helpful? Thank you for your feedback!
Sorry about that.
How can we improve it?