754
Real Estate Analytics Power BI Dashboard 6
Real Estate Analytics Power BI Dashboard 6
More Report pages
Report Author: Dao Tran
754
Share template with others
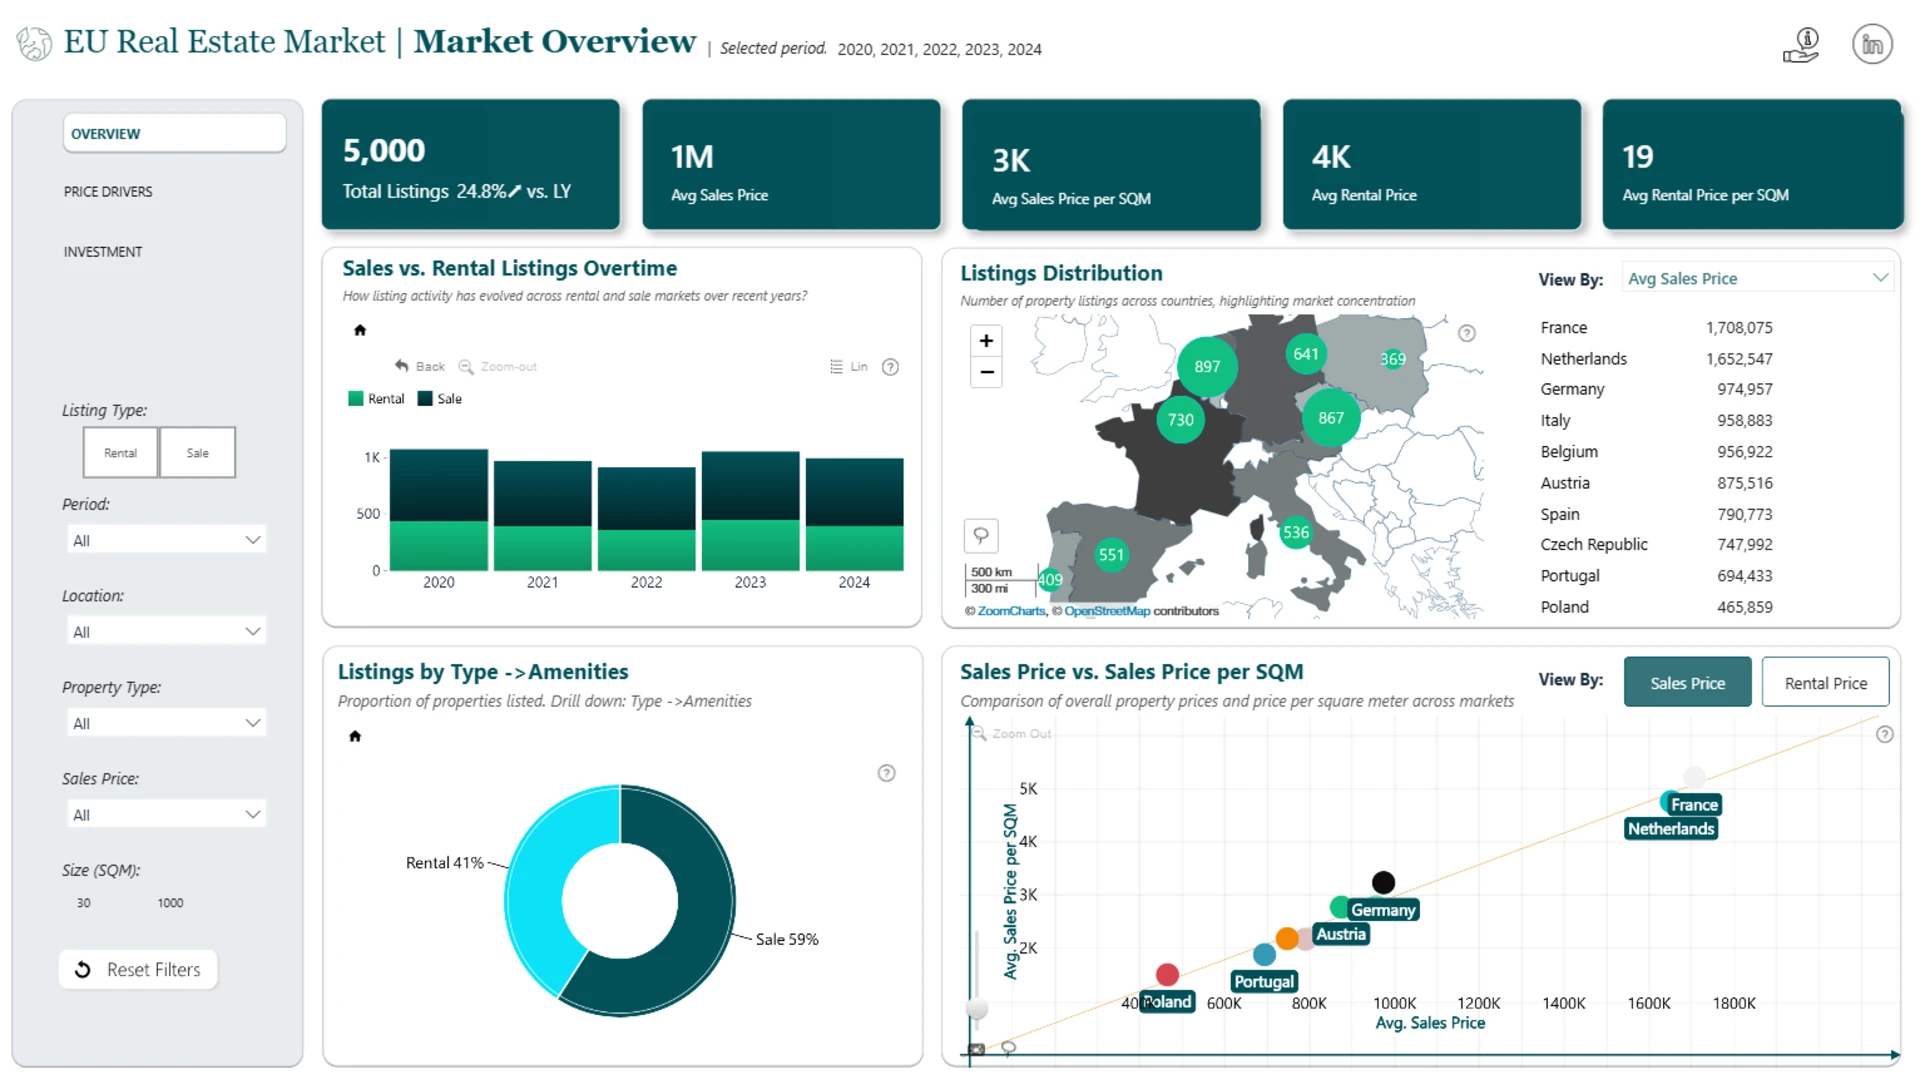
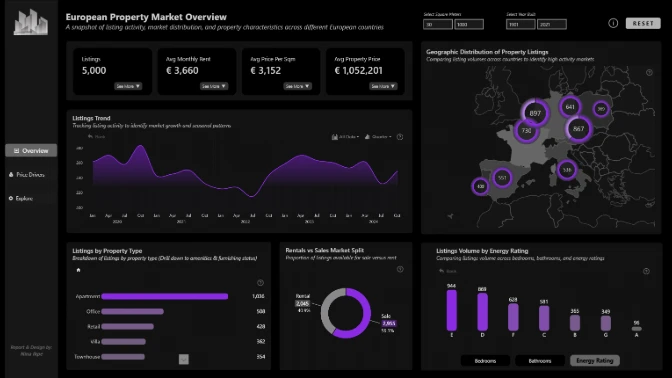
This interactive Power BI report explores the European Real Estate Market Analytics dataset using ZoomCharts Drill Down custom visuals for Power BI. It highlights property prices, price per square meter, listing activity, and property characteristics across countries and cities, helping users identify market trends, compare locations, and evaluate investment opportunities.
The report was submitted to the FP20 Analytics ZoomCharts Data Challenge #36 (March – April 2026).
Author’s Description:
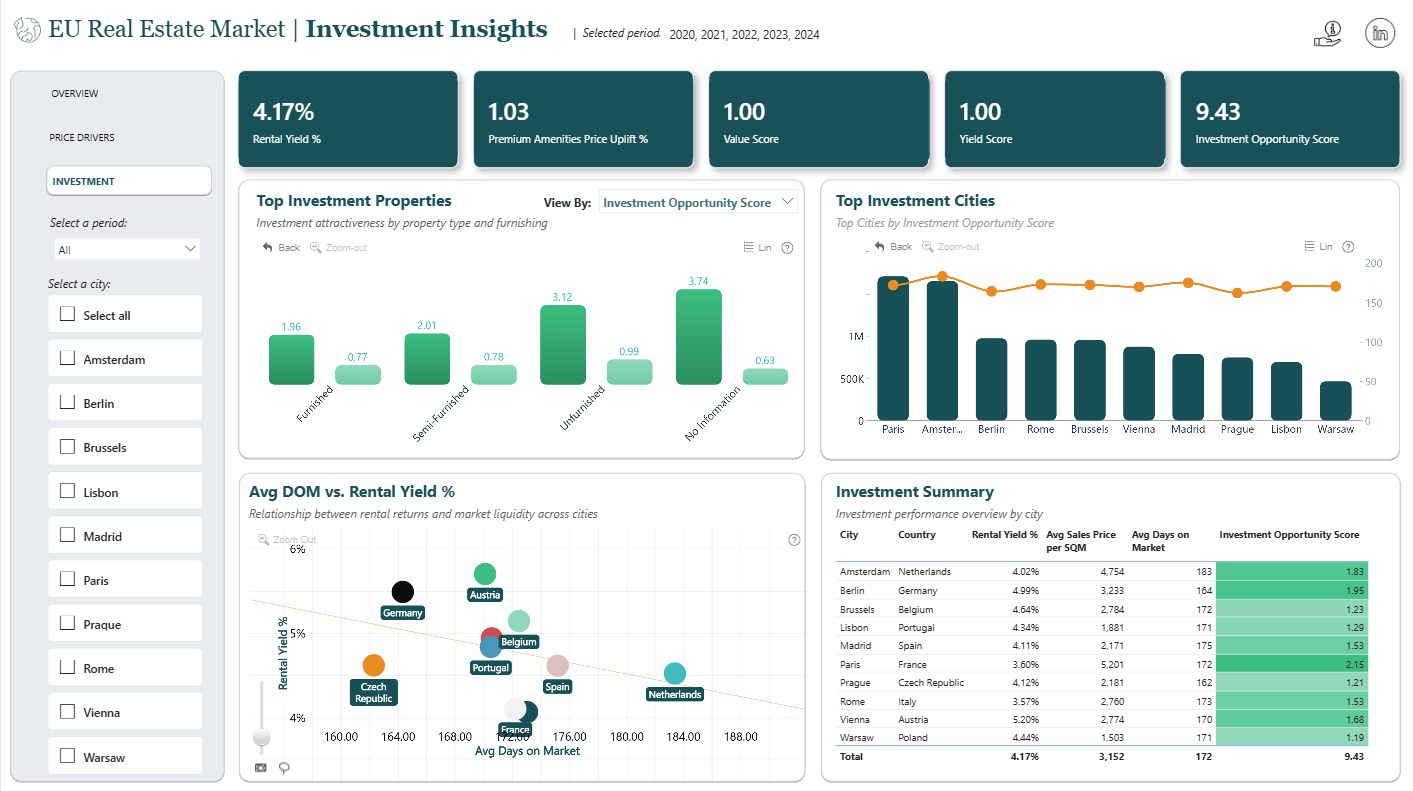
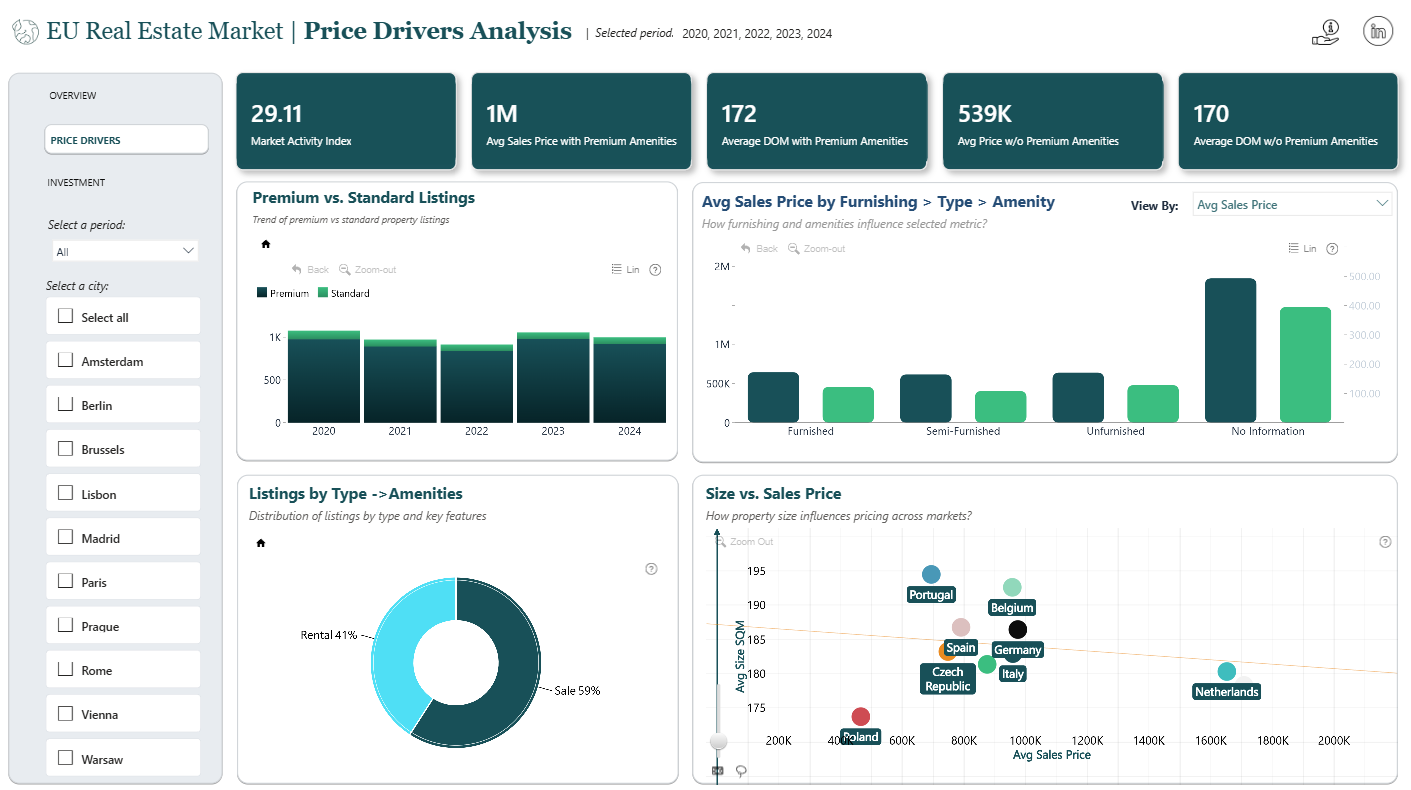
This report is structured into three key pages to guide analysis of the European real estate market. The Market Overview highlights price differences across countries and cities, helping identify where real estate is most and least expensive. The Price & Demand Drivers page explores how factors such as size, layout, and amenities influence pricing, along with variations in market activity reflected in days on market. The Investment Insights page evaluates opportunities using rental yield, price per square meter, and market liquidity to identify high-potential locations. Key metrics include Value Score, Yield Score, and a composite Investment Opportunity Score combining return, value, and liquidity.
ZoomCharts visuals used
4U Report Challenges
Participate in data challenges, build and submit reports to get free template downloads.
Join CommunityMobile view allows you to interact with the report. To Download the template please switch to desktop view.


Was this helpful? Thank you for your feedback!
Sorry about that.
How can we improve it?