104
Property Value & Market Activity Dashboard 7
Property Value & Market Activity Dashboard 7
Report Author: Mohamed Kadri
104
Share template with others
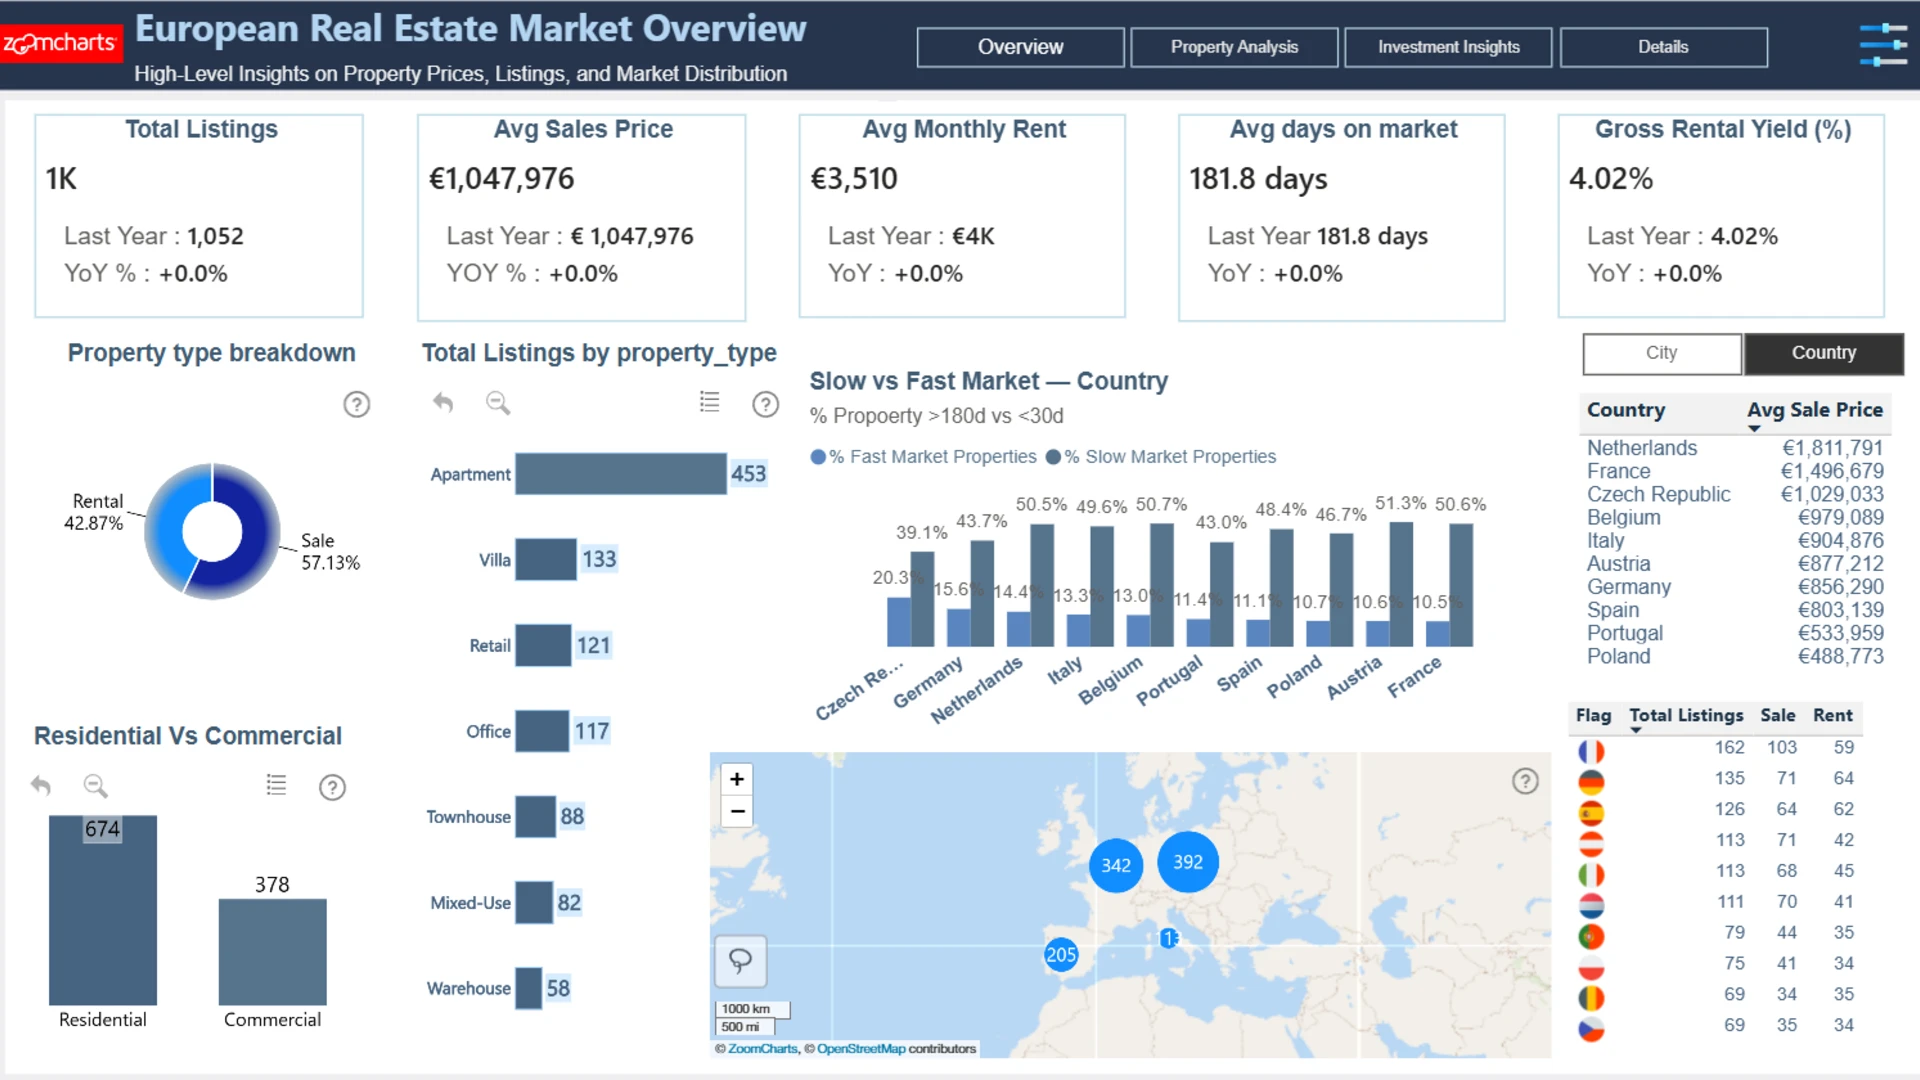
This interactive Power BI report explores the European Real Estate Market Analytics dataset using ZoomCharts Drill Down custom visuals for Power BI. It highlights property prices, price per square meter, listing activity, and property characteristics across countries and cities, helping users identify market trends, compare locations, and evaluate investment opportunities.
The report was submitted to the FP20 Analytics ZoomCharts Data Challenge #36 (March – April 2026).
Author’s Description:
𝗣𝗮𝗴𝗲 𝟭 - Market Overview
Geographic drill-down across Europe, KPI cards with YoY comparisons, price-per-m² benchmarking by country, listing activity trends, and slow vs. fast market signals.
𝗣𝗮𝗴𝗲 𝟮 - Price & Property Deep Dive
Scatter analysis of size vs. price, amenity premium quantification (gym, pool, elevator, parking), building-age impact on pricing, and days-on-market analysis by energy rating and furnishing status.
𝗣𝗮𝗴𝗲 𝟯 - Investor Opportunities
Quadrant analysis (sale price × rental yield), a composite Investor Score, a Market Tension Score to identify high-value, low-activity cities, and risk-adjusted return ranking.
ZoomCharts visuals used
Need help?
Send your question to ZoomCharts assistant, and we will respond to you as soon as possible.
Contact UsMobile view allows you to interact with the report. To Download the template please switch to desktop view.


Was this helpful? Thank you for your feedback!
Sorry about that.
How can we improve it?