169
ProfitLens: Ecommerce Profitability & Growth Power BI Dashboard
ProfitLens: Ecommerce Profitability & Growth Power BI Dashboard
More Report pages
Report Author: Mahato Rita
169
Share template with others
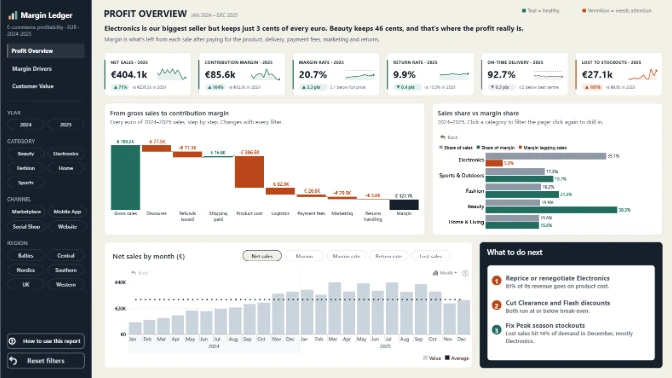
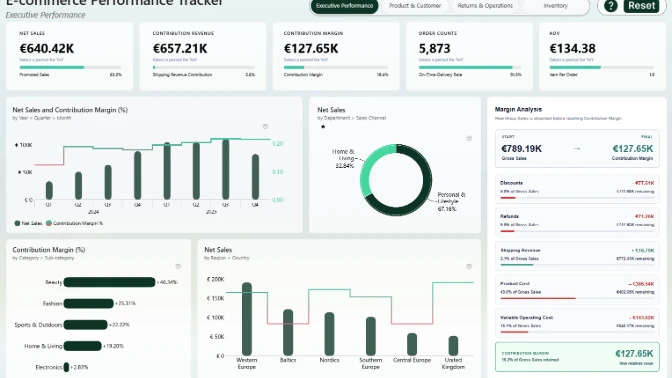
ProfitLens is an interactive Power BI dashboard designed to show where e-commerce profitability is being lost and what is driving those losses.
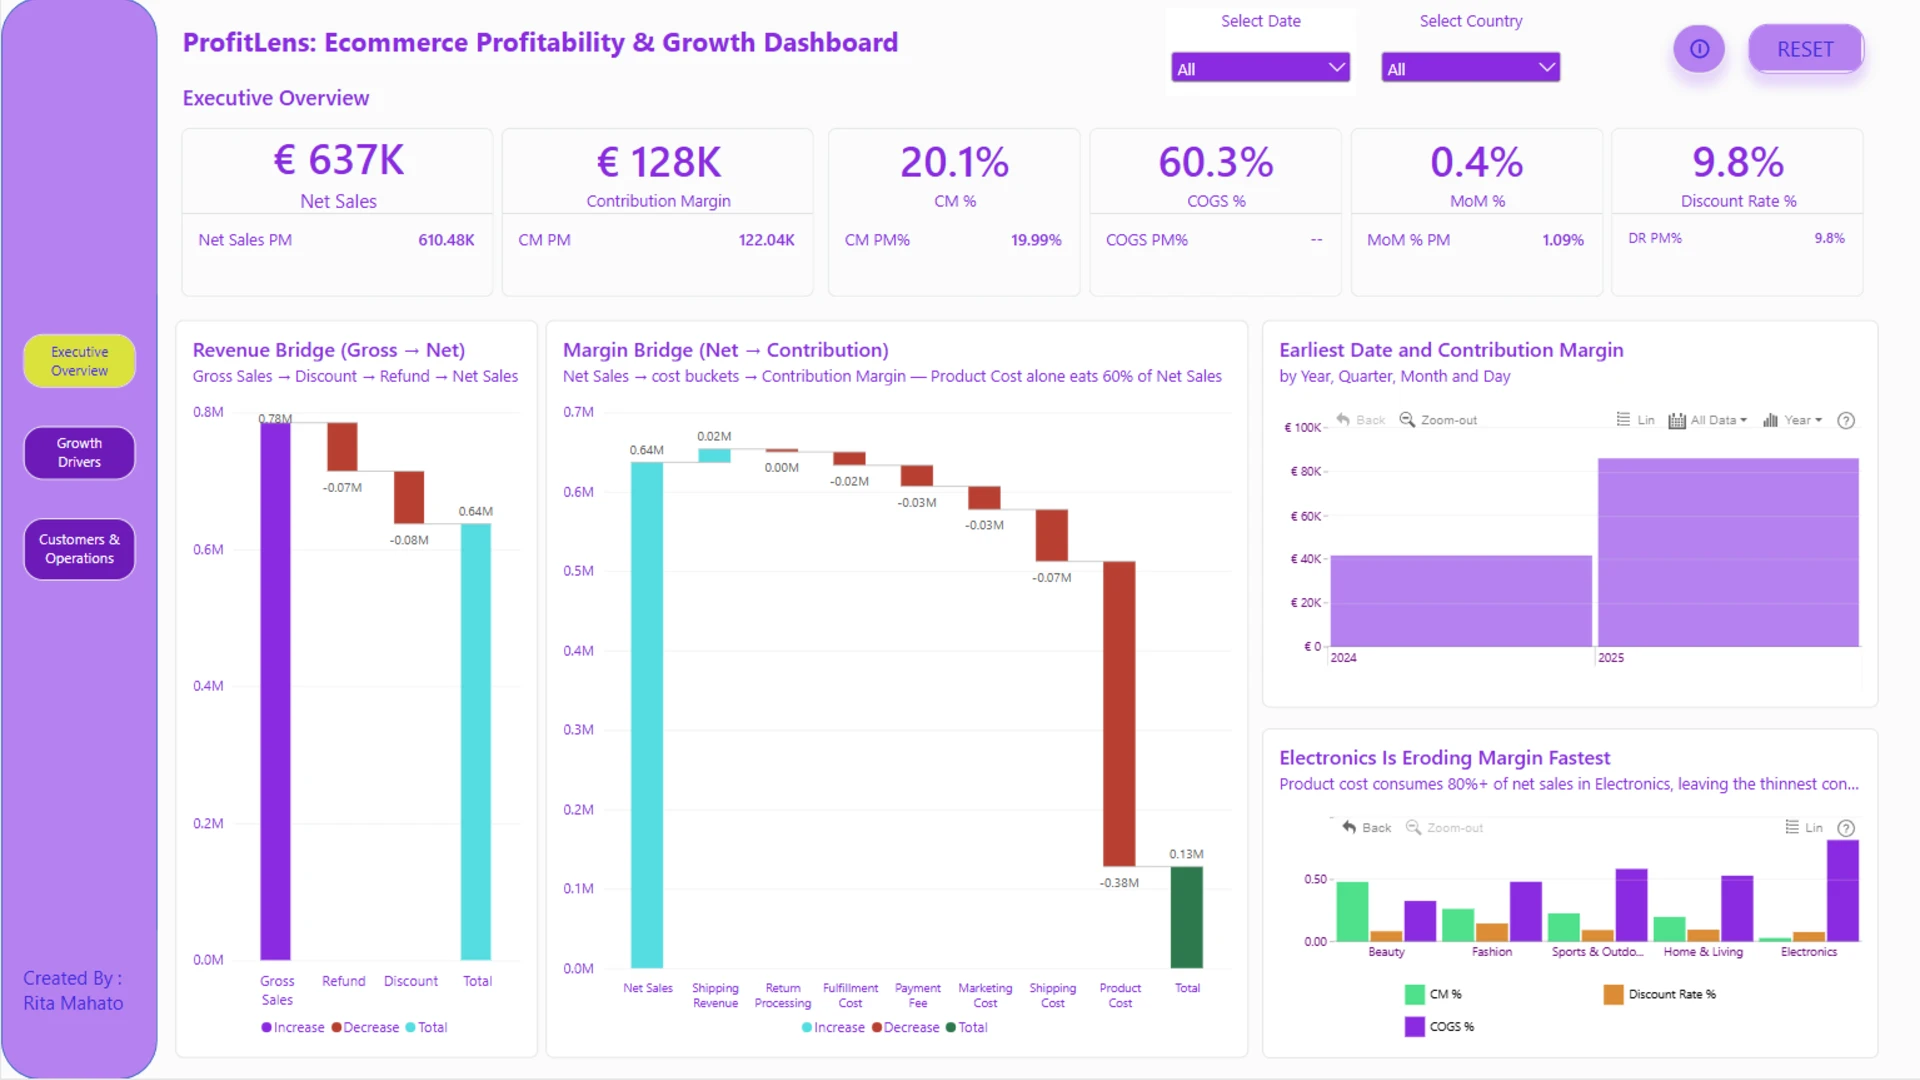
The report starts with Revenue and Margin Bridges that follow the journey from gross sales to net sales and contribution margin. One of the clearest findings is the impact of product cost, which consumes around 60% of net sales and represents the largest cost component in the business.
Returns
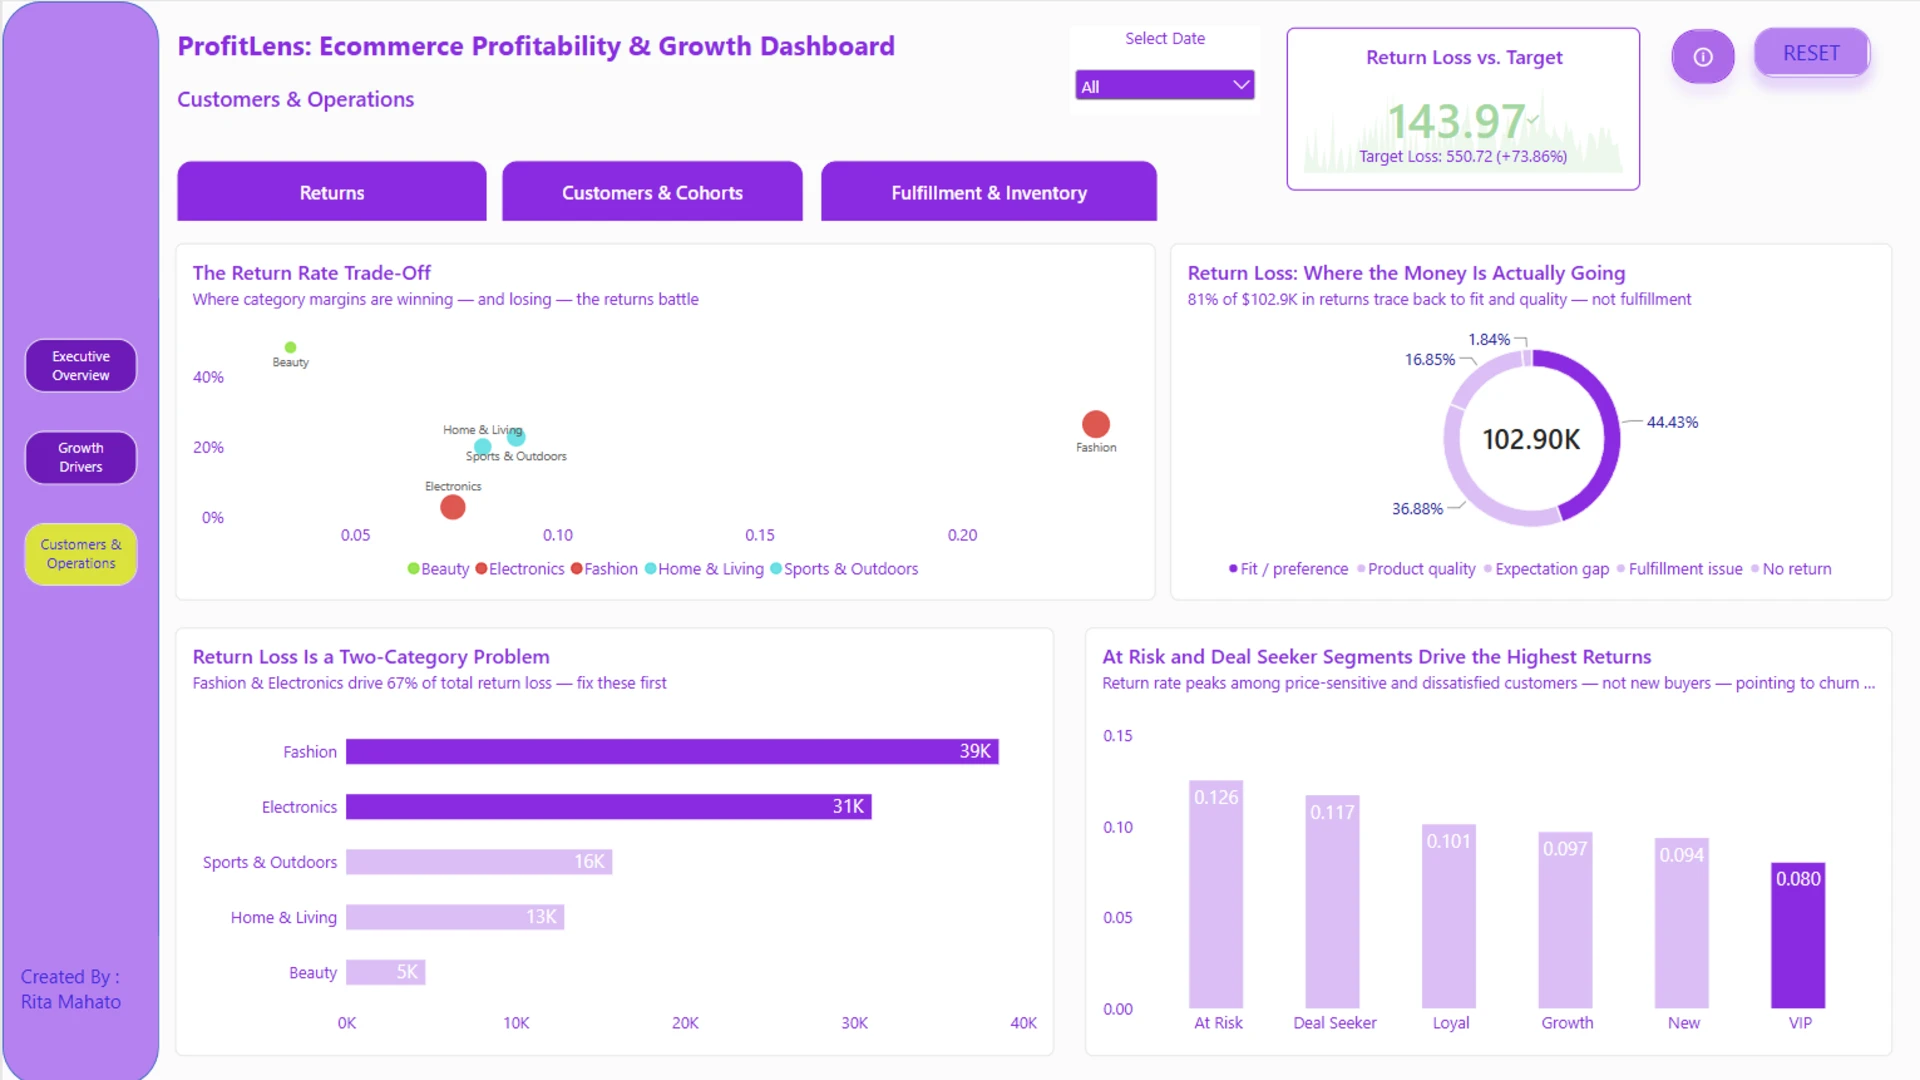
The returns analysis shows that most losses are linked to product fit, customer preference, and product quality rather than fulfilment issues. Around 81% of return losses come from these areas, while fulfilment-related returns account for just 1.8%. Fashion and Electronics together generate 67% of total return losses.
Customers & Cohorts
The customer analysis looks at retention and profitability over time. Active customer numbers decline significantly after the first few months, while average contribution margin per customer remains relatively stable. This suggests that the main challenge is retaining customer volume rather than a decline in the value of retained customers.
The analysis also compares customer segments and shows that Loyal and Growth customers generate stronger profitability than the VIP segment.
Fulfilment & Inventory
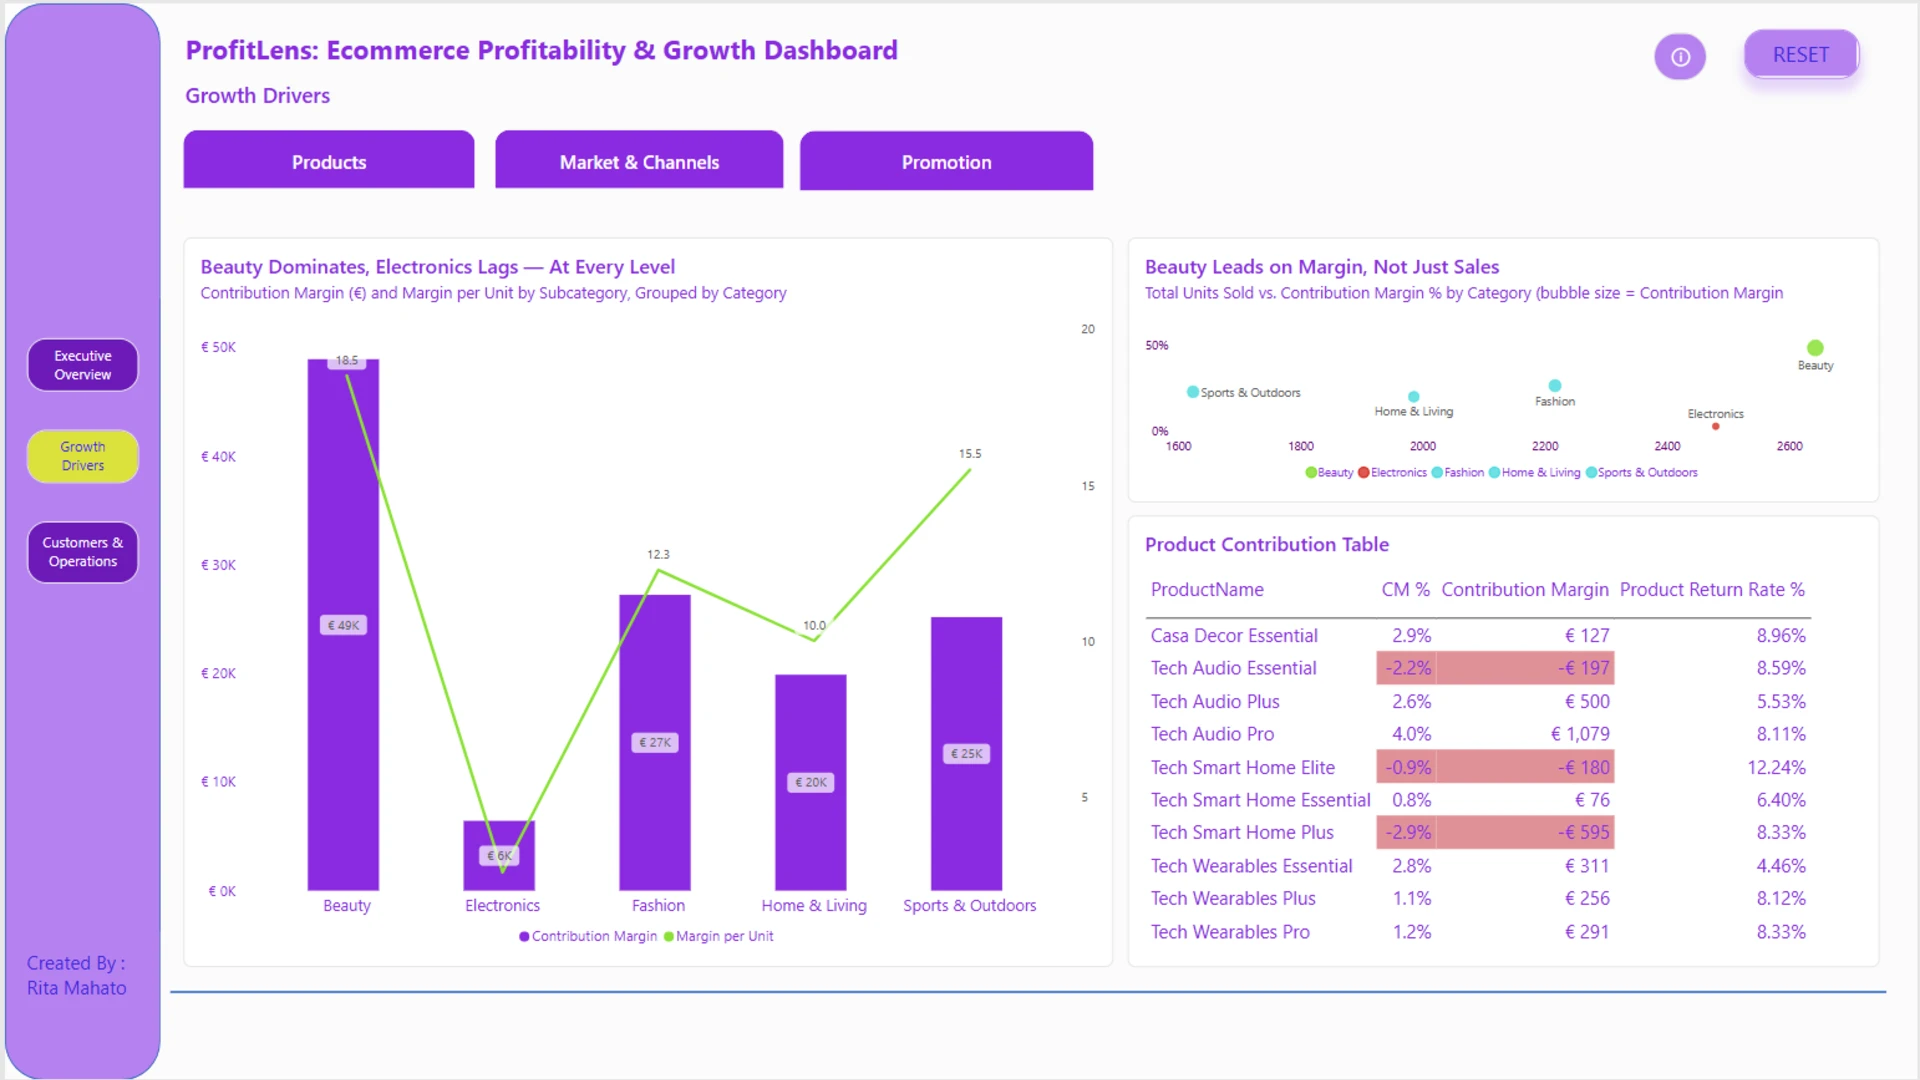
The operations page compares fulfilment costs with delivery performance across carriers and locations. Some higher-cost shipping routes do not deliver better on-time performance, making it possible to identify areas where the business is paying more without receiving a corresponding improvement in service.
A category-level drill-down provides a closer look at product profitability. Electronics stands out as the lowest-margin category, with product costs consuming more than 80% of sales and leaving almost no contribution margin. The analysis indicates that the main issue is related to sourcing and cost structure rather than discounting or returns.
The report was built in Power BI using DAX and ZoomCharts Drill Down PRO visuals, based on the 4U Reports E-Commerce Profitability Challenge dataset covering 2024–2025.


4U Report Challenges
Participate in data challenges, build and submit reports to get free template downloads.
Join CommunityMobile view allows you to interact with the report. To Download the template please switch to desktop view.
How to use a PBIX template
Preview the interactive report, download the PBIX file, open it in Power BI Desktop, and replace the same data connection with your own dataset.
Preview and download
Explore the report online and download the PBIX template file.
Open in Power BI Desktop
Open the downloaded PBIX file in Power BI Desktop.
Connect your data
Replace the sample data source with your own dataset.
Refresh and adjust
Refresh the model and update fields or visual were needed.
Save and share
Save your report and publish it for your audience.


