451
Procurement Spend Optimization Dashboard 2
Procurement Spend Optimization Dashboard 2
More Report pages
Report Author: Endre Balazs
451
Share template with others
This interactive Power BI report explores the Procurement dataset using ZoomCharts Drill Down custom visuals and native Power BI visuals. It analyzes purchase order activity from 2022 to 2024, highlighting procurement spend, supplier performance, budget versus actuals, savings, delivery timelines, supplier risk, and maverick spend across categories, departments, regions, and suppliers.
The report helps users identify spending trends, compare supplier performance, monitor compliance, evaluate budget pressure, and uncover opportunities to improve procurement efficiency, reduce risk, and support better purchasing decisions.
The report was submitted to the FP20 Analytics ZoomCharts Data Challenge 37 (April-May 2026).
Author’s Description:
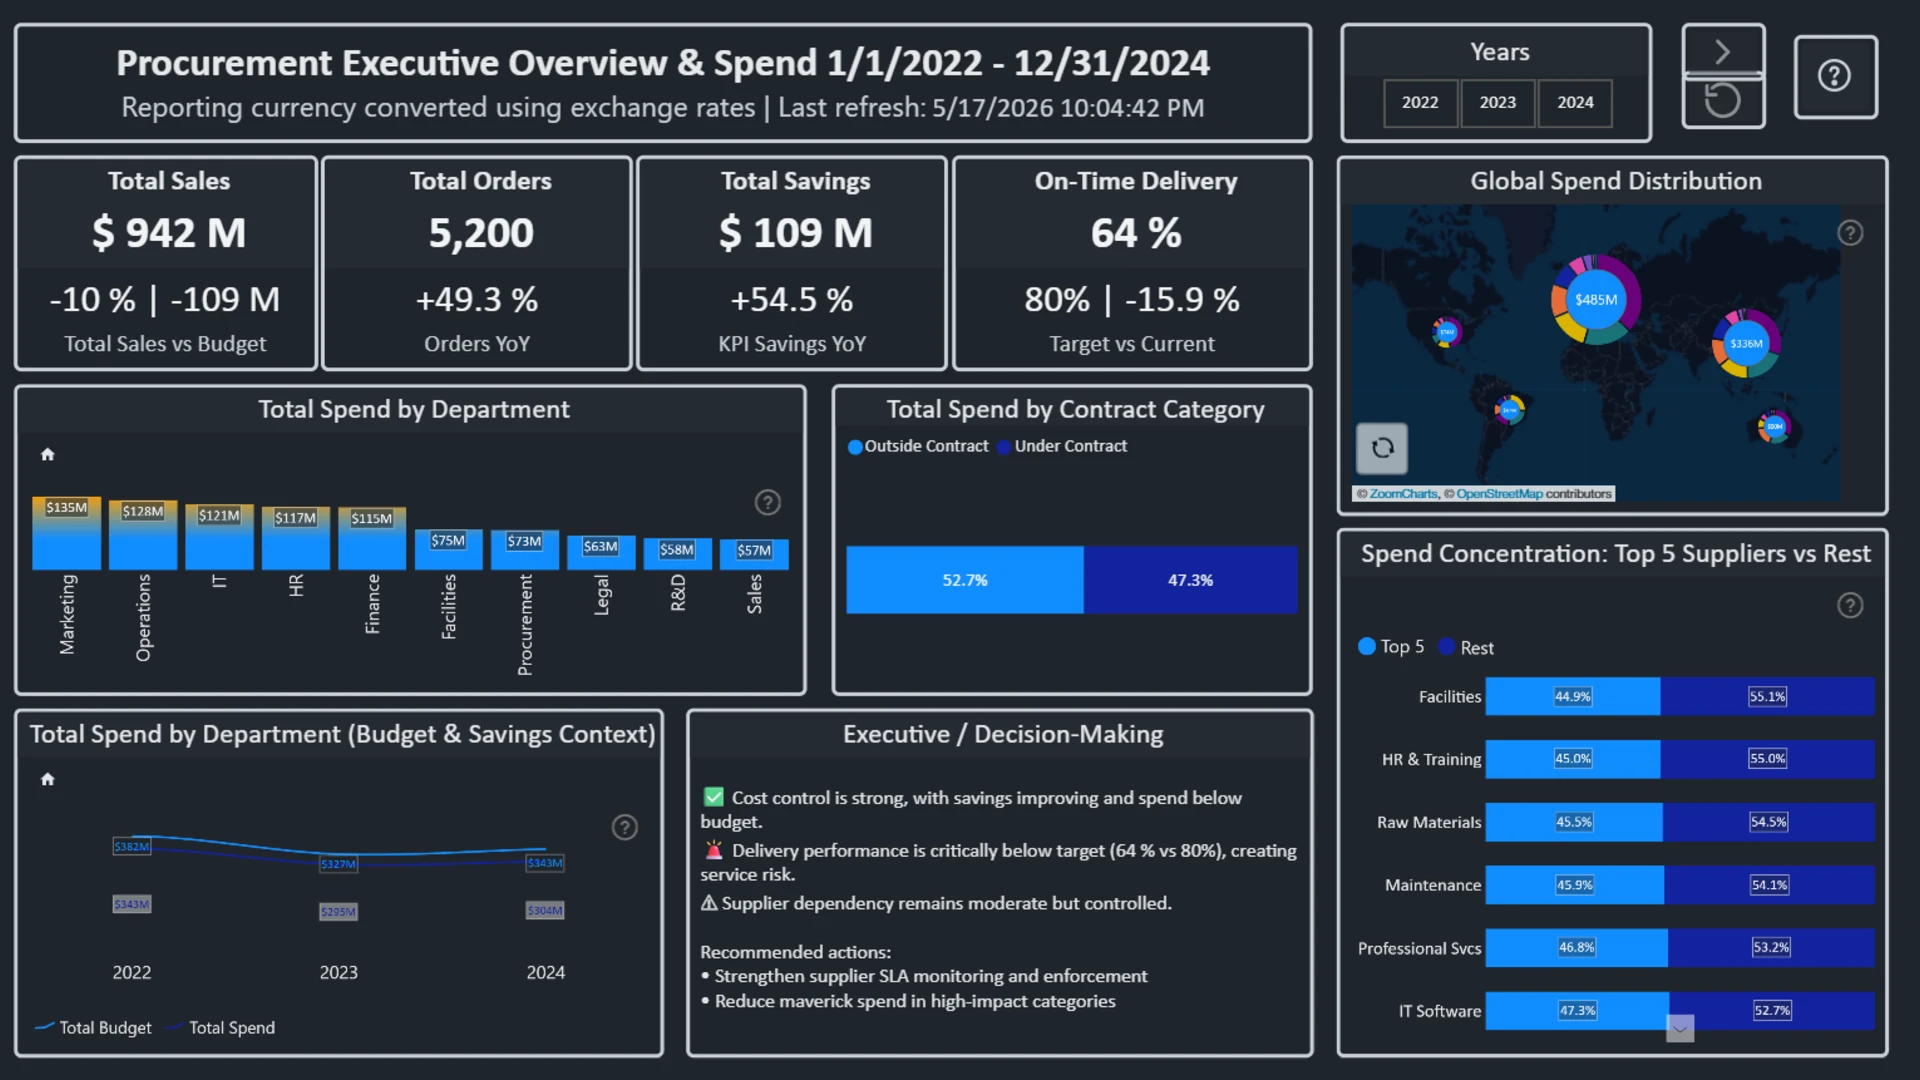
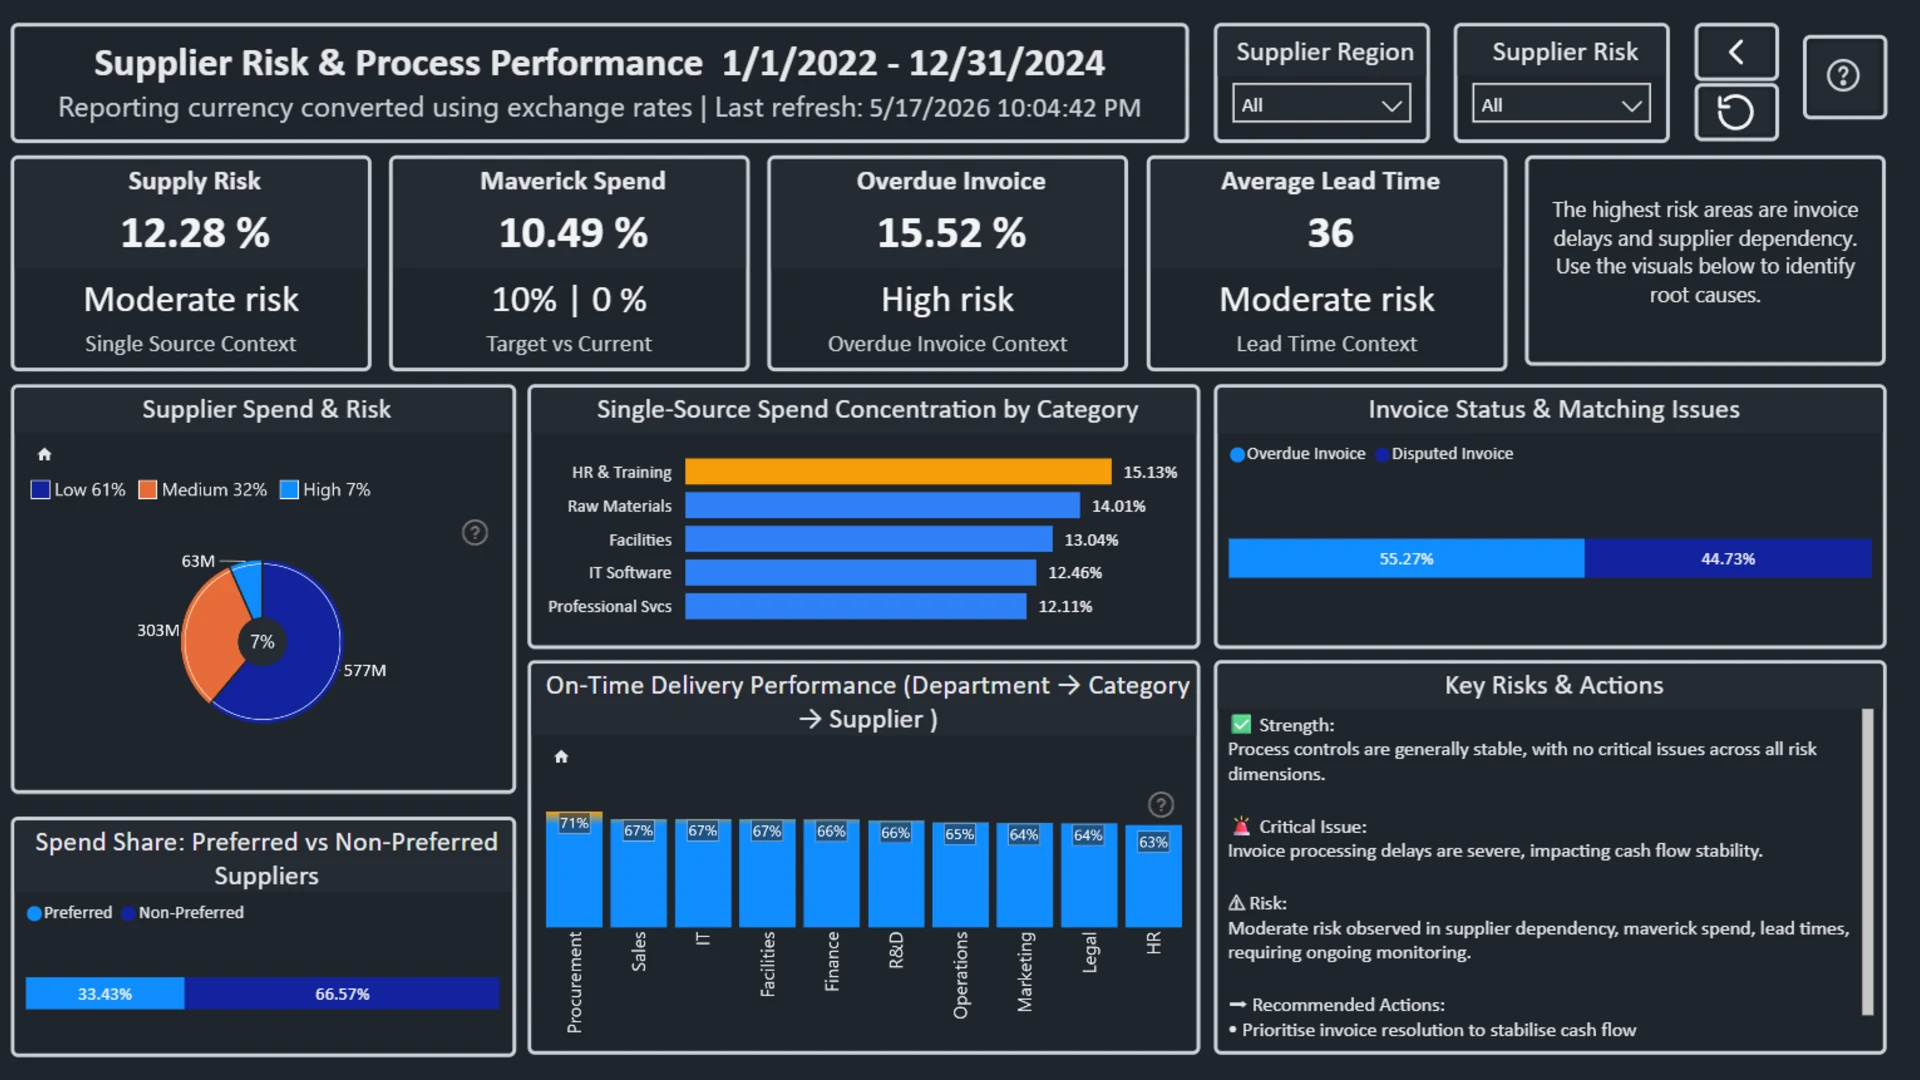
Procurement Executive Overview and Supplier Risk Performance is a Power BI dashboard developed for FP20 Analytics Challenge 37 to support data-driven procurement decision-making. The report analyzes 5,200 procurement records from 2022 to 2024, representing approximately $942M in total spend, and provides visibility into spend performance, savings, supplier risk, delivery reliability, and compliance.
The dashboard is structured across two pages: Executive Overview and Spend, and Supplier, Risk, and Process Performance. It enables users to analyze procurement trends, supplier performance, maverick spend, invoice delays, lead times, and contract coverage through interactive drill-down exploration. Built using Power BI and ZoomCharts Drill Down Visuals, the report delivers intuitive navigation and actionable procurement insights.
ZoomCharts visuals used
4U Report Challenges
Participate in data challenges, build and submit reports to get free template downloads.
Join CommunityMobile view allows you to interact with the report. To Download the template please switch to desktop view.
Was this helpful? Thank you for your feedback!
Sorry about that.
How can we improve it?