3232
Power BI Travel Dashboard Template: Summer Destinations
Power BI Travel Dashboard Template: Summer Destinations
More Report pages
Report Author: ZoomCharts
3232
Share template with others
Summary
This Power BI Travel Dashboard Template provides an interactive way to explore holiday destinations, travel costs, flight availability, accommodation options, and destination scores in one visual report.
Designed as a Summer Holiday Finder, the dashboard helps users compare available destinations and quickly identify attractive travel options based on cost per person, direct flight availability, travel offer volume, destination type, accommodation type, and overall destination score.
The report combines travel data analytics with interactive Power BI visualizations, allowing users to move from a high-level overview to individual destinations and offers.
Travel Dashboard Summary
This Power BI travel dashboard helps users compare holiday destinations, analyze travel costs, review flight and accommodation options, and identify attractive destinations based on affordability, availability, weather comfort, and overall destination scores.
It can support travel agencies, tourism analysts, holiday marketplaces, and businesses building customer travel recommendation tools.
Travel Dashboard Overview
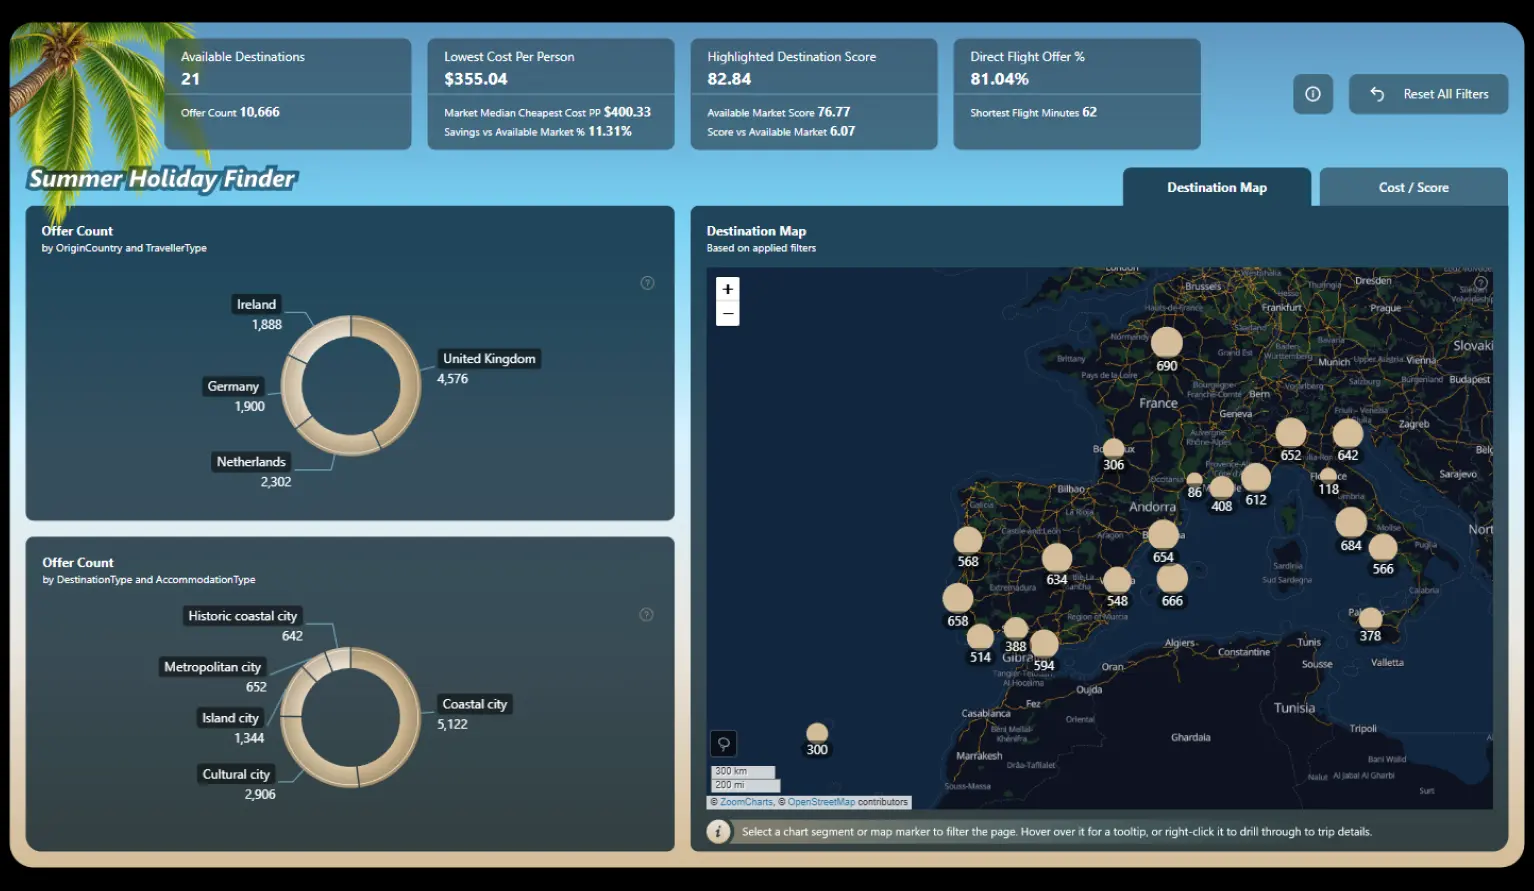
The main dashboard highlights key travel KPIs, including:
- Available Destinations - see how many destinations match the current selection.
- Lowest Cost Per Person - identify the most affordable holiday options and compare them with the market median.
- Destination Score - evaluate destinations using an overall attractiveness score.
- Direct Flight Availability - understand what percentage of available offers include direct flights.
- Flight Duration - quickly identify destinations with shorter travel times.
- Travel Offer Volume - compare the number of available offers across origin countries, traveller types, destination categories, and accommodation types.
Interactive Destination Analysis
The interactive destination map provides a geographic overview of available holiday locations across Europe and surrounding regions. Users can select destinations directly on the map to filter the report and investigate specific travel opportunities.
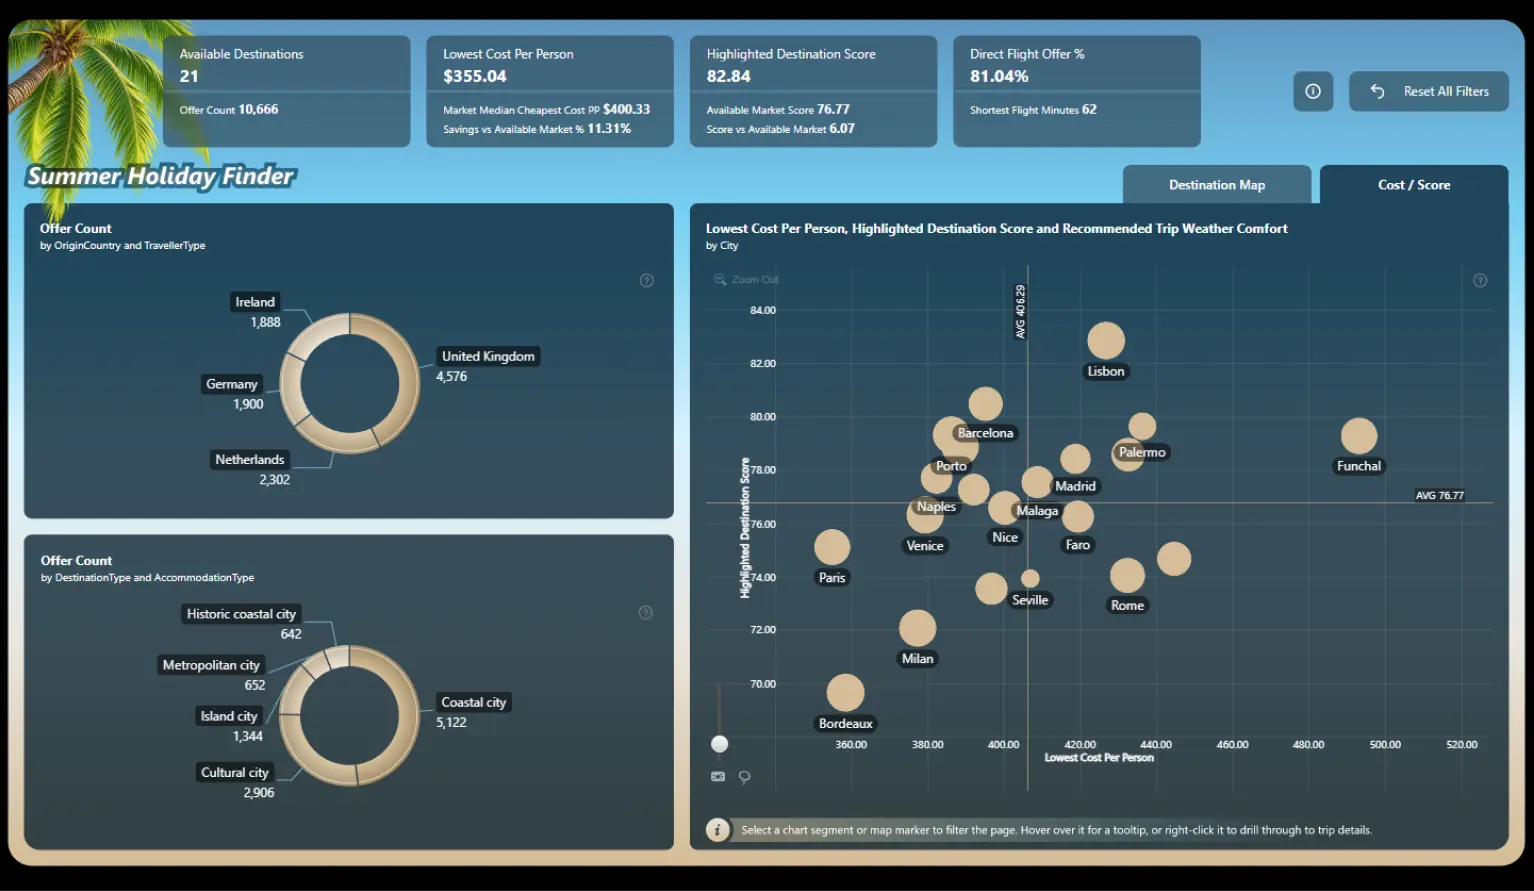
The dashboard also includes a cost and destination score analysis that compares destinations based on:
- Lowest cost per person
- Destination score
- Recommended trip weather comfort
- Relative position compared with market averages
This makes it easier to identify destinations that offer a strong combination of affordability and travel experience.
Power BI Travel Analytics Use Cases
This Power BI dashboard template can be used as inspiration for:
- Travel agency dashboards
- Tourism analytics
- Holiday package comparison
- Destination performance analysis
- Travel offer analysis
- Flight and accommodation analysis
- Customer travel recommendation tools
- Travel marketplace reporting
Download the Power BI PBIX Template
Download the Power BI PBIX template to explore the report structure, travel analytics approach, interactive dashboard design, and data visualization techniques used in this Summer Holiday Finder.
Built with interactive ZoomCharts Drill Down visuals for Power BI, the report demonstrates how travel data can be transformed into an intuitive destination discovery and comparison experience.



4U Report Challenges
Participate in data challenges, build and submit reports to get free template downloads.
Join CommunityMobile view allows you to interact with the report. To Download the template please switch to desktop view.



How to use a PBIX template
Preview the interactive report, download the PBIX file, open it in Power BI Desktop, and replace the same data connection with your own dataset.
Preview and download
Explore the report online and download the PBIX template file.
Open in Power BI Desktop
Open the downloaded PBIX file in Power BI Desktop.
Connect your data
Replace the sample data source with your own dataset.
Refresh and adjust
Refresh the model and update fields or visual were needed.
Save and share
Save your report and publish it for your audience.


