297
Power BI Software Reliability and Downtime Risk Dashboard
Power BI Software Reliability and Downtime Risk Dashboard
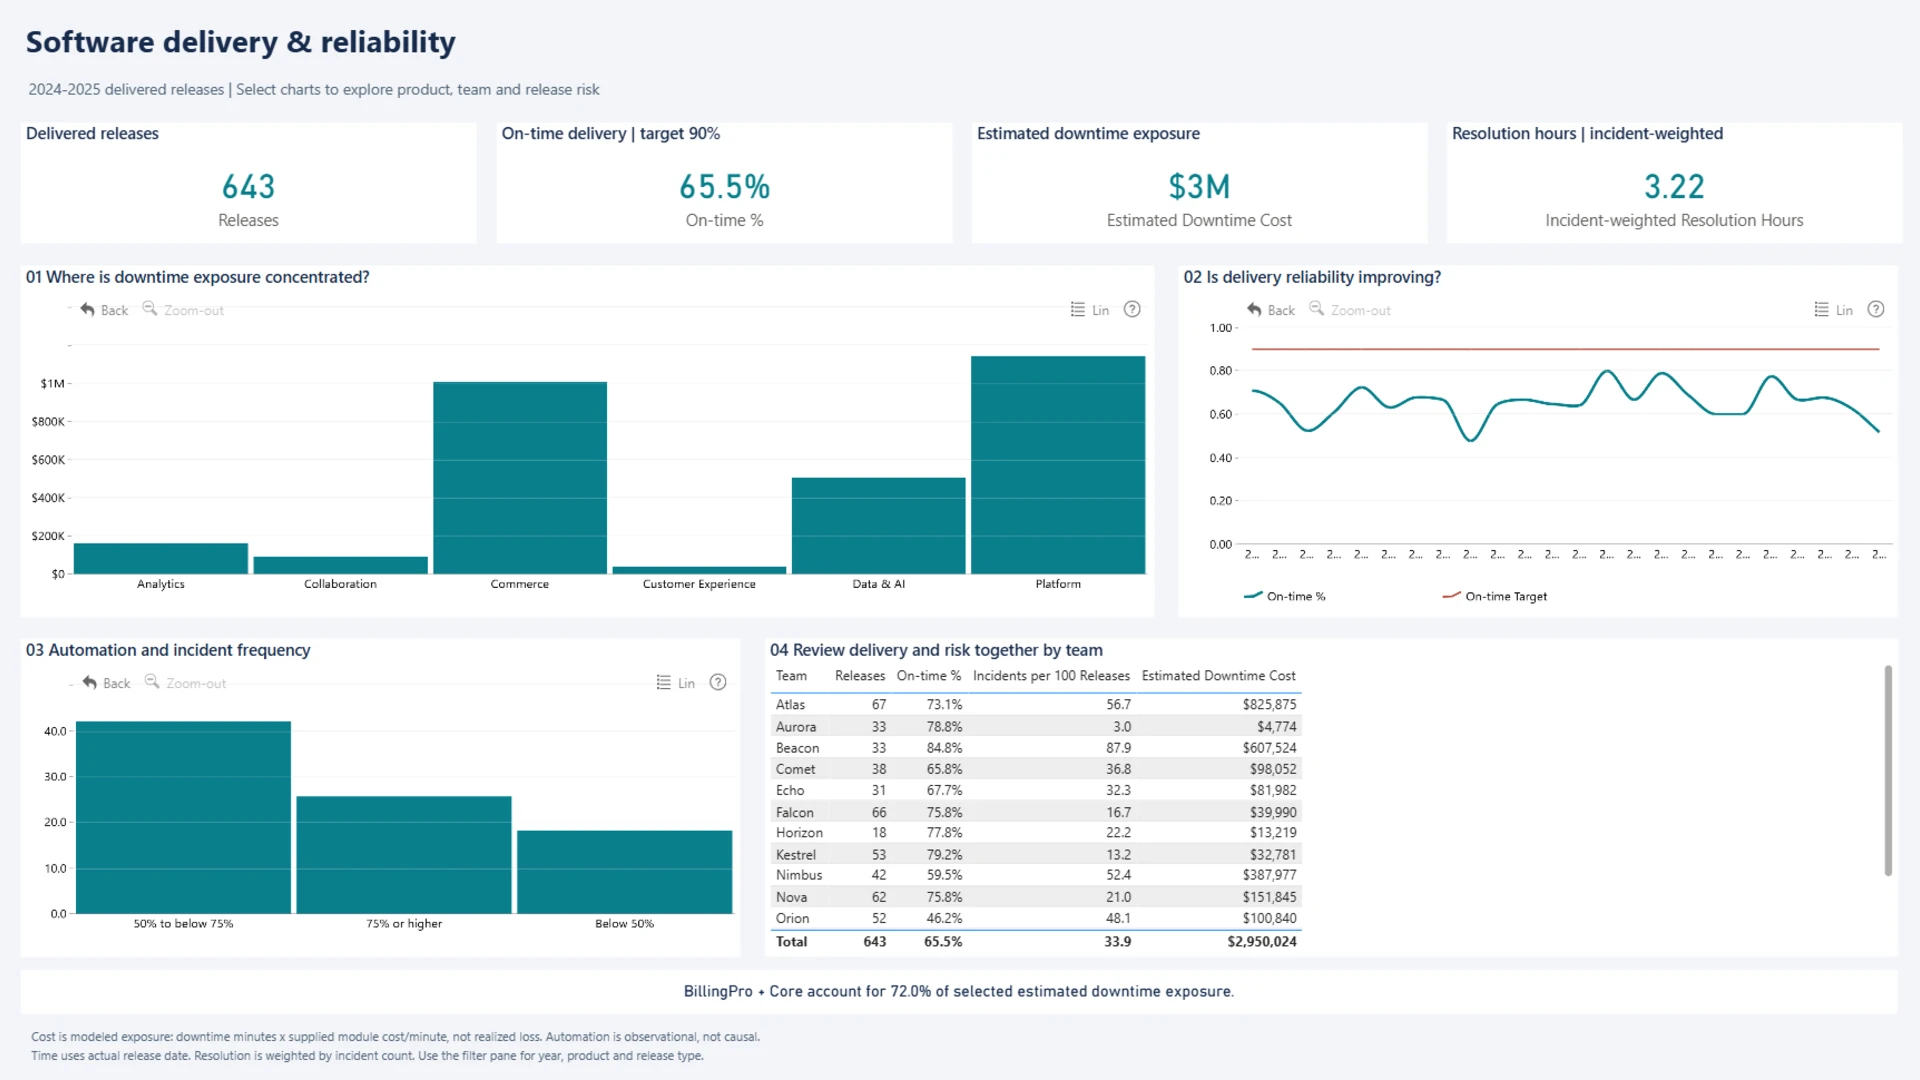
Report Author: Minwoo Jeong
297
Share template with others
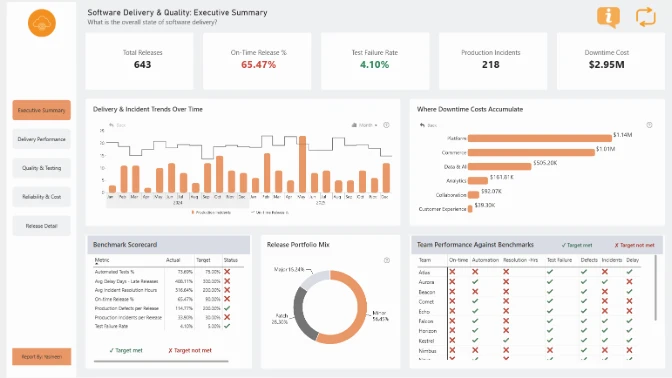
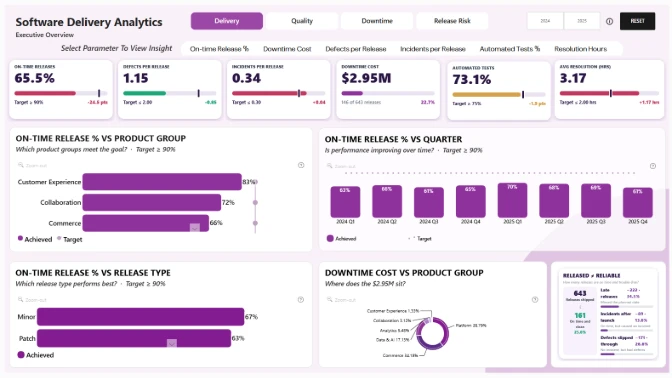
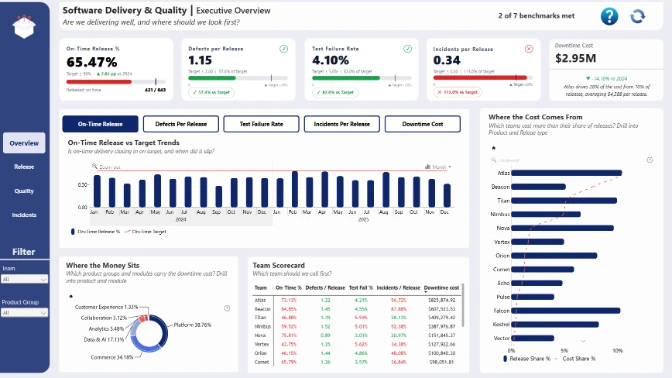
Explore this Power BI software reliability dashboard to analyze software delivery performance, production incidents, downtime costs, and operational risks. Monitor on-time release rates, incident resolution times, and delivery reliability trends to evaluate software quality and release management performance.
Compare estimated downtime costs across product groups, analyze the relationship between test automation coverage and incident frequency, and identify development teams with higher operational risks. Review team-level release performance, incident rates, and downtime exposure using interactive ZoomCharts Drill Down PRO visuals. The dashboard supports software quality monitoring, production incident analysis, DevOps reporting, and software delivery risk assessment across 2024 and 2025.
Created for the ZoomCharts Power BI Software Delivery & Quality Analytics Challenge. To access the dataset, open the challenge page and select "Get the dataset" on the left side of the page.
ZoomCharts visuals used

4U Report Challenges
Participate in data challenges, build and submit reports to get free template downloads.
Join CommunityMobile view allows you to interact with the report. To Download the template please switch to desktop view.
How to use a PBIX template
Preview the interactive report, download the PBIX file, open it in Power BI Desktop, and replace the same data connection with your own dataset.
Preview and download
Explore the report online and download the PBIX template file.
Open in Power BI Desktop
Open the downloaded PBIX file in Power BI Desktop.
Connect your data
Replace the sample data source with your own dataset.
Refresh and adjust
Refresh the model and update fields or visual were needed.
Save and share
Save your report and publish it for your audience.


