logo
For Power BI
  • Products
    • Custom Visuals for Power BI
    • Report Templates
  • Resources

      Resources

    • Documentation
    • Report Examples
    • Blog
    • Webinars
    • Video Tutorials
    • Visuals Gallery

    Support

    • ZoomCharts Assistance
    • Contact Sales
    • Contact Support
    • FAQ

    Challenges

    Challenges

    Improve your report creation skills by participating in free challenges for report creators.

    Learn more
    Get Developer License
  • Services
    • Power BI Report Development
    • Custom Visual Development
  • Challenges
  • Pricing
    • Custom Visuals for Power BI
    • Report Templates
Get started
Get started
Get it now
Go back

Contents

Go back

FP20 Analytics February 2025 Challenge

Report Author: Andreas Miftakhul Pratama

20065

Power BI Shipment Tracking and Logistics Performance Report

Report
Report Interact

Combo Bar Timeline Map Donut Transportation Project Management Logistics

Share template with others

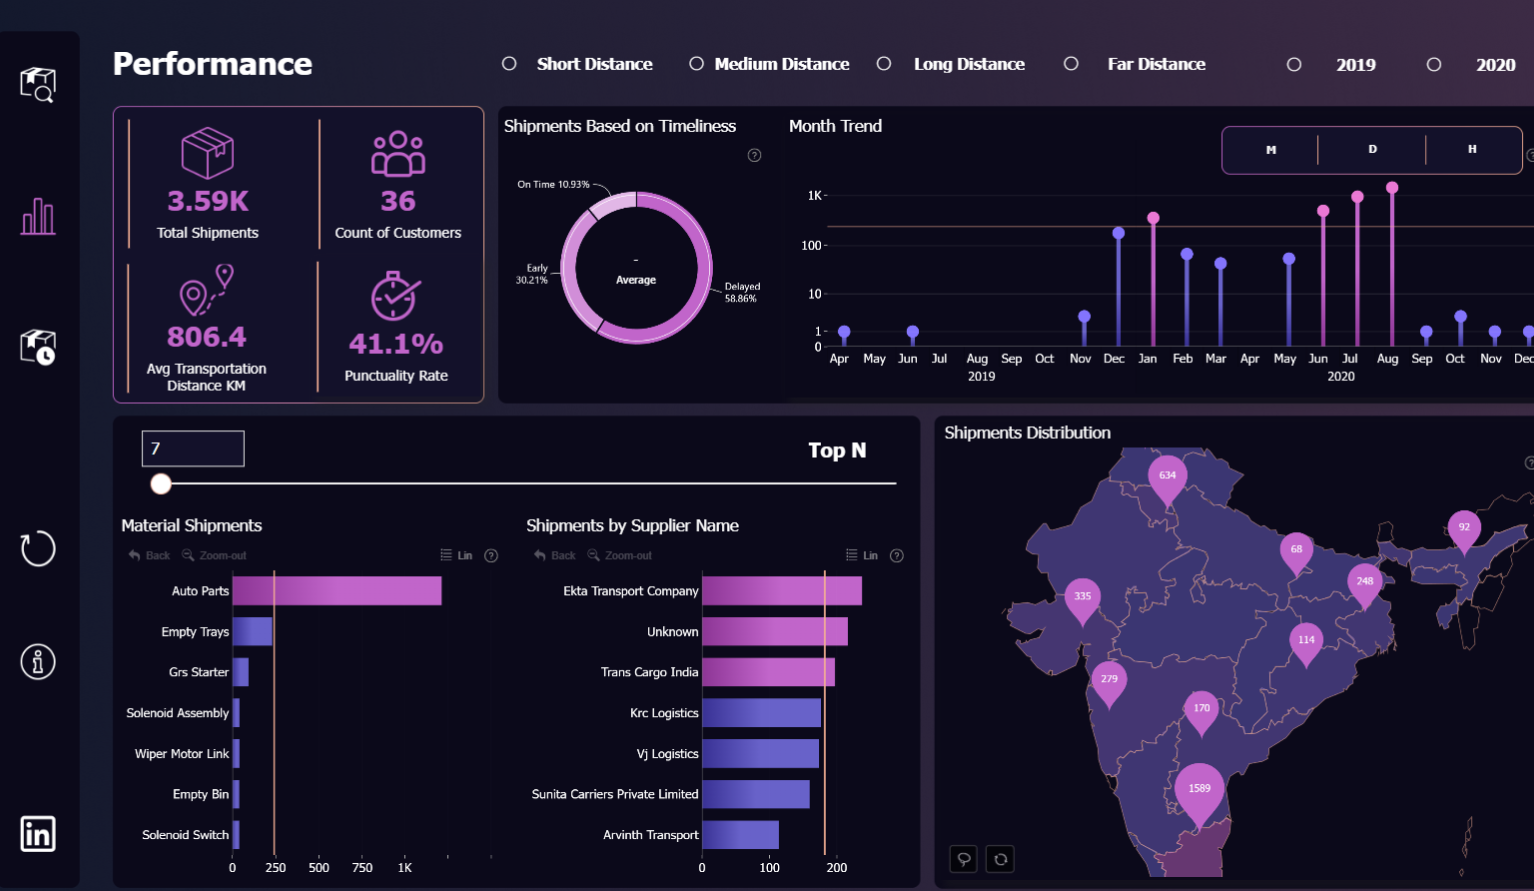
This Power BI shipment tracking and logistics performance report template helps logistics teams, supply chain managers, and analysts monitor shipments, delivery performance, delays, and transportation efficiency in one interactive dashboard.

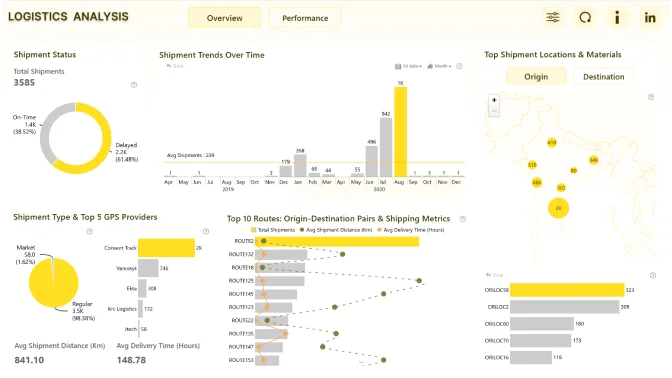
Designed for logistics and supply chain analysis, the report provides visibility into shipment volumes, on-time delivery rates, transportation distance, supplier performance, and delivery delays, with drill-down capabilities across time, distance, customers, and locations.

Use this Power BI logistics dashboard to:

  • Track shipment performance and delivery status
  • Monitor on-time, early, and delayed shipments
  • Analyze shipment delays by route, supplier, and GPS provider
  • Identify high-risk customers and frequently delayed shipments
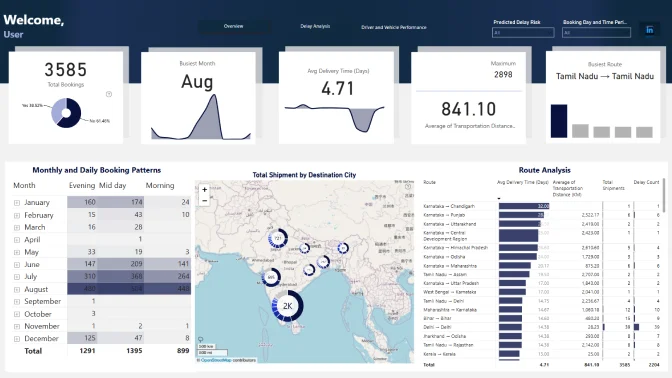
  • Review shipment trends by month, year, and distance
  • Track individual shipments with booking-level details

Key pages and metrics included:

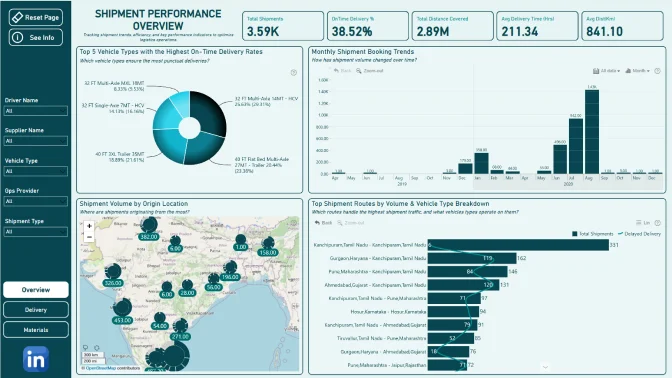
  • Logistics performance overview with KPI cards
  • Shipment volume and customer analysis
  • On-time vs delayed shipment distribution
  • Shipment delay analysis by route, provider, and customer
  • Shipment tracking page with real-time progress and milestones
  • Geographic shipment distribution map

Shipment and logistics KPIs:

  • Total shipments and customers
  • Average transportation distance
  • Punctuality and on-time delivery rate
  • Shipment delay count and average delay days
  • Pre-trip and in-transit delays
  • Shipment performance by supplier and material

Interactive Power BI features:

  • Drill-down from summary to shipment-level details
  • Cross-filtering across performance, delays, and geography
  • Zoomable charts for dense logistics data
  • Map-based shipment visualization
  • Time-based filtering by year, month, and distance

Who this report is for:

  • Logistics and supply chain managers
  • Operations and delivery teams
  • Transportation planners
  • Business and data analysts
  • Power BI developers building logistics dashboards

This Power BI logistics and shipment tracking report template is fully customizable in Power BI Desktop and can be adapted to your transportation data, shipment system, suppliers, and KPIs. 
Report submitted for the FP20 Analytics ZoomCharts Challenge, February-March 2025. The report was built using the Transportation & Logistics Dataset and includes ZoomCharts custom Drill Down PRO visuals for Power BI.

ZoomCharts visuals used

Drill Down Combo Bar PRO Drill Down Combo Bar PRO
Drill Down Map PRO Drill Down Map PRO
Drill Down Timeline PRO Drill Down Timeline PRO
Drill Down Donut PRO Drill Down Donut PRO

Need help?

Send your question to ZoomCharts assistant, and we will respond to you as soon as possible.

Contact Us

Mobile view allows you to interact with the report. To Download the template please switch to desktop view.

Report Overhaul

ZoomCharts Academy

Learn ZoomCharts with experts and become certified!

Go to Academy!
Report Overhaul

Was this helpful? Thank you for your feedback!

Sorry about that.

How can we improve it?

Power BI Shipment Tracking and Logistics Performance Report

Share

ZoomCharts

Welcome to ZoomCharts

You’re almost there! Create an account to download reports.

or
Sign up with Microsoft

Verify your email address

We have sent a code to your email address. Please input the code below.

Didn't receive code? Request again (after 30 seconds)

Already have an account? Log in

ZoomCharts

Log in to your ZoomCharts account

Log in with Microsoft
or
Forgot password?

Reset your password

We'll email you instructions on how to reset your password

Don't have an account? Sign up

Please add credits

You have 0 available downloads.
Get more credits or upgrade your plan to continue.

View pricing
logo
[email protected]
+44 204 577 3993
logo

Products

Drill Down Network PRO Drill Down Waterfall PRO Drill Down Graph PRO Drill Down Combo PRO Drill Down Combo Bar PRO Drill Down Donut PRO Drill Down Pie PRO Drill Down TimeSeries PRO Drill Down Timeline PRO Drill Down Map PRO Drill Down Scatter PRO All Visuals

Resources

Report Examples Webinars Blog ZoomCharts Academy Visuals Gallery Documentation Custom Visual Development Subscribe to News

Solutions

Custom Visual Development

Company

Pricing About Us Partners Leave feedback Join PowerGroup EU Funding

Help

ZoomCharts Assistance Contact Sales Contact Support FAQ

Drill Down Network PRO Drill Down Waterfall PRO Drill Down Graph PRO Drill Down Combo PRO Drill Down Combo Bar PRO Drill Down Donut PRO Drill Down Pie PRO Drill Down TimeSeries PRO Drill Down Timeline PRO Drill Down Map PRO Drill Down Scatter PRO All Visuals

Report Examples Webinars Blog ZoomCharts Academy Visuals Gallery Documentation Custom Visual Development Subscribe to News

Custom Visual Development

Pricing About Us Partners Leave feedback Join PowerGroup EU Funding

ZoomCharts Assistance Contact Sales Contact Support FAQ
+44 204 577 3993
[email protected]

Ready to get in touch?

Contact our experts with any question about Power BI and ZoomCharts for Free!

Contact us

© 2026, Data Visualization Software Lab

U.S. Patents No. 11,645,343; 11,921,804; 12,346,389

Cookies
Privacy Policy
Global
Legal
Patent
warning

Error message

success

Success info: Done!

ZoomCharts AI Assistant

We noticed you're using an old OS version.

For the best experience, we recommend upgrading to ensure that all website features display correctly.

Cookie settings

We use necessary cookies for site functionality, as well as statistic, marketing, and preference cookies to enhance your experience. For more information and to manage your preferences, please visit our Cookie policy