573
Power BI Sales by Region Dashboard
Power BI Sales by Region Dashboard
More Report pages
Report Author: Samim Imtiaz
573
Share template with others
This Power BI Sales by Region Dashboard analyzes global B2B sales performance across regions, countries, industries, customer segments, sales teams, channels, promotions, and product categories.
The report combines sales, profitability, target, and return metrics to provide a complete view of commercial performance and help users identify where growth, profitability, and execution issues originate.
Key Metrics
- Revenue and year-over-year sales performance
- Gross Profit and Profit Margin %
- Order Volume and Average Order Value
- Return Rate and return impact
- Revenue Target, Target Variance, and Achievement %
- Performance by region, country, industry, segment, channel, sales team, and salesperson
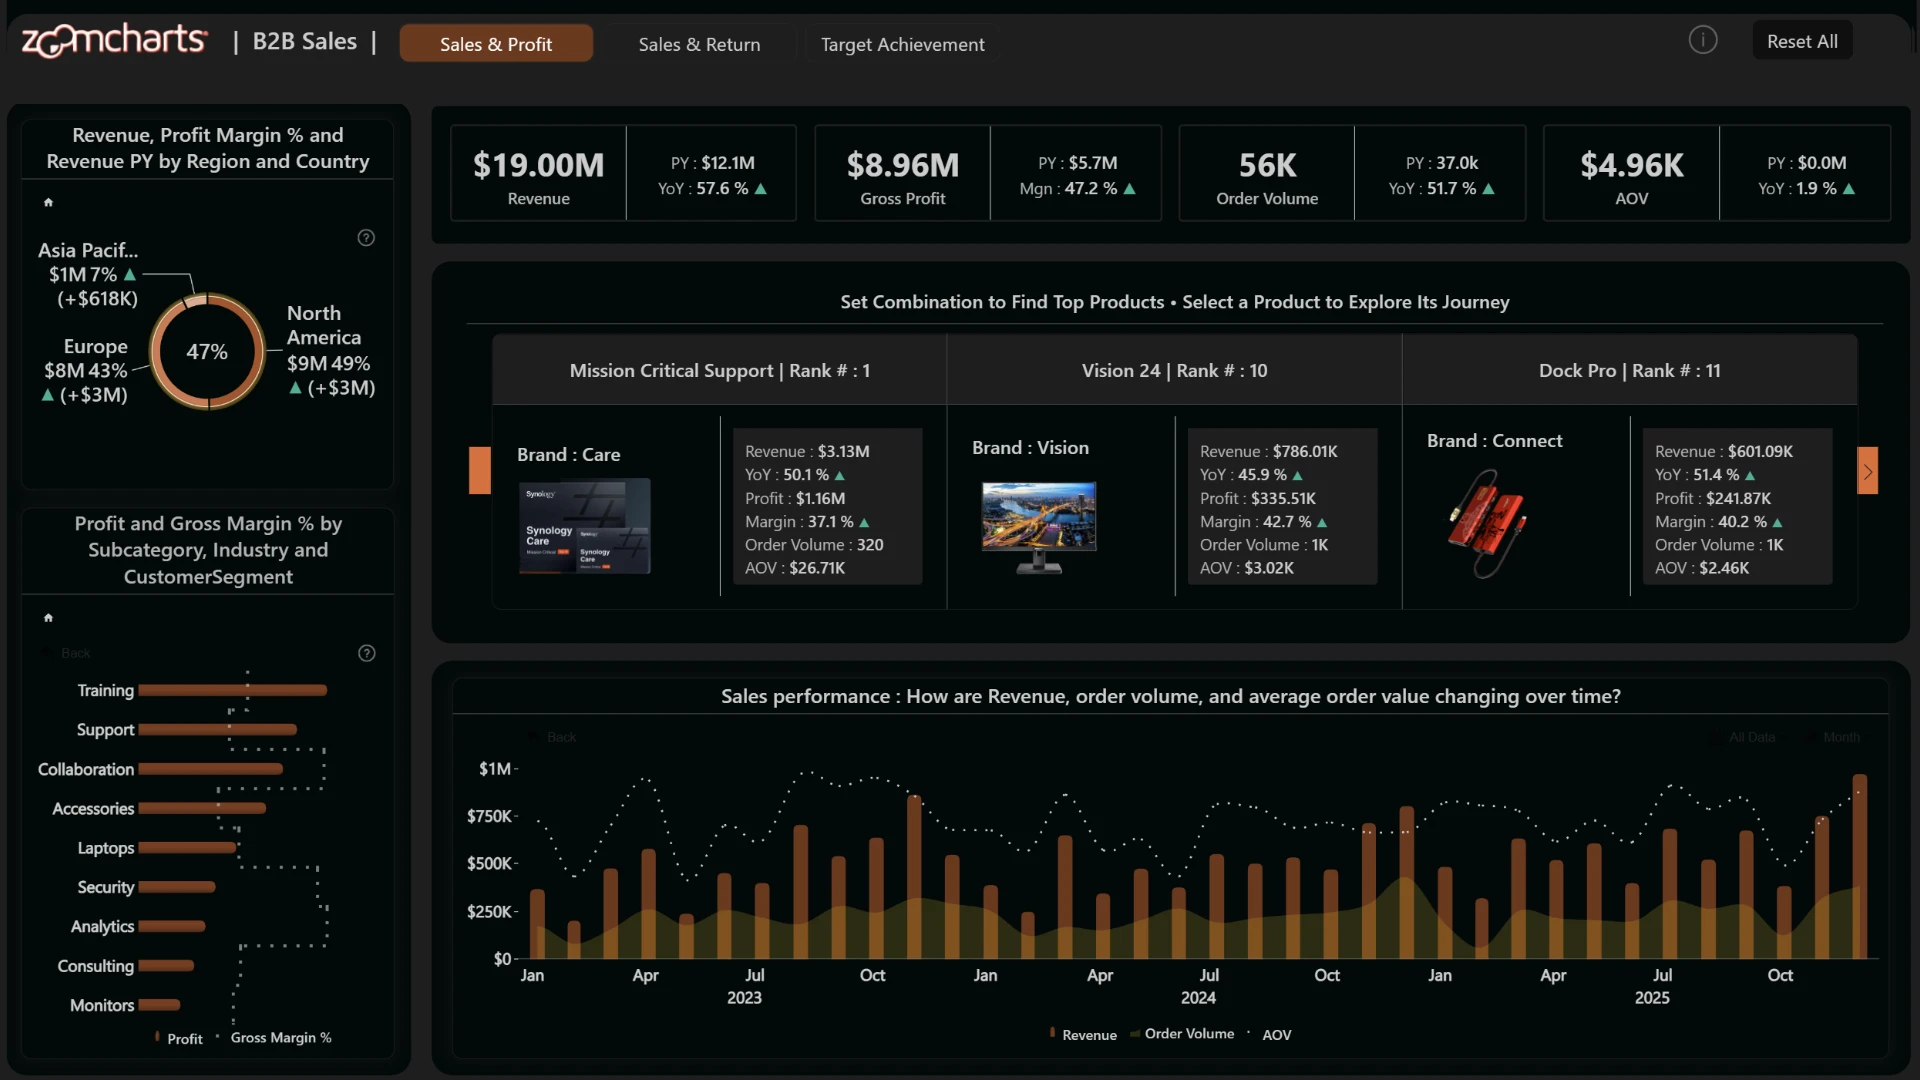
Sales & Profit
The Sales & Profit view helps users compare Revenue, Gross Profit, Order Volume, and Average Order Value across different markets and product groups.
- Compare Revenue and Profit Margin across regions and countries.
- Analyze profitability by subcategory, industry, and customer segment.
- Identify top-performing products based on Revenue, Profit, Margin, Order Volume, and AOV.
- Explore monthly sales trends to understand how Revenue, Order Volume, and Average Order Value change over time.
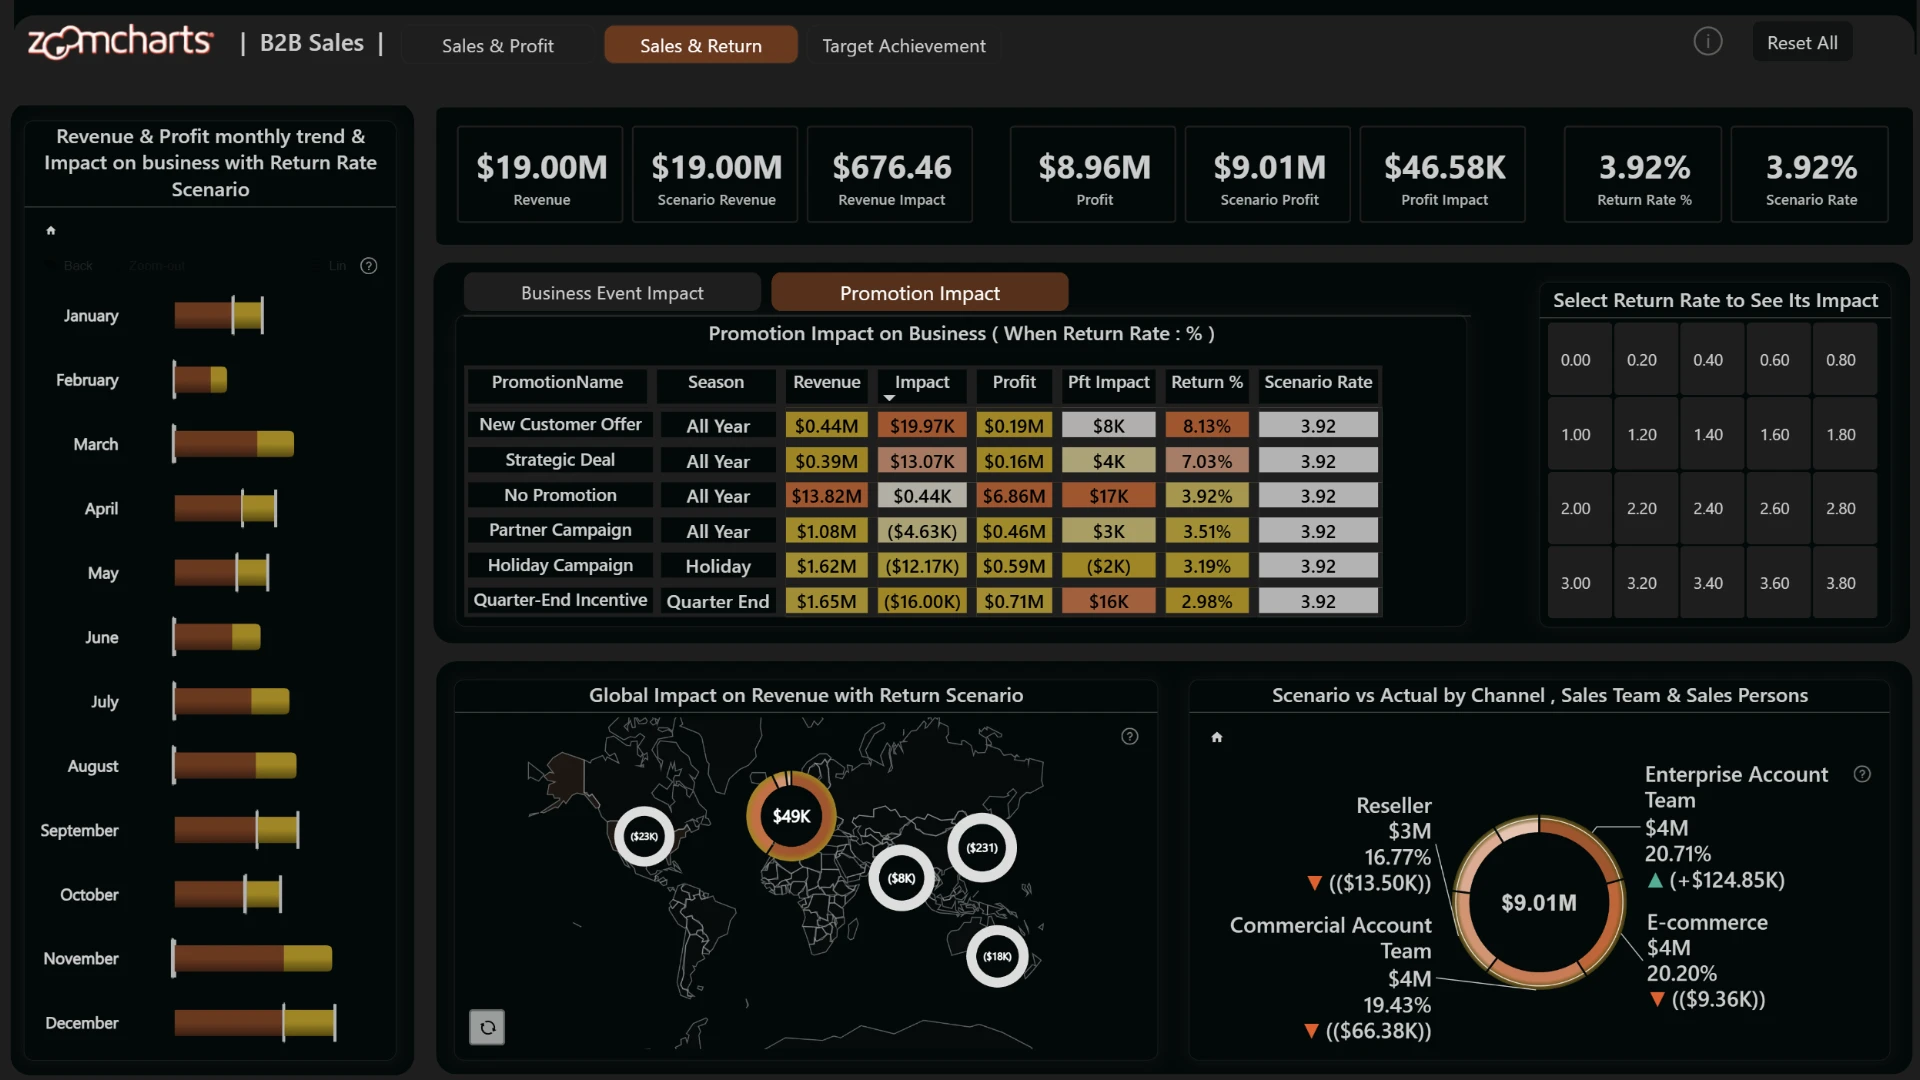
Sales & Return
The Sales & Return view focuses on the relationship between sales performance, profitability, and product returns. Interactive scenarios allow users to change the Return Rate and immediately see the potential impact on Revenue and Profit.
- Compare actual Revenue and Profit with scenario-adjusted results.
- Analyze Return Rate by month, promotion, and season.
- Measure how different promotions affect Revenue, Profit, and Return Rate.
- Explore the geographic impact of return scenarios across global markets.
- Compare scenario impact across channels, sales teams, and individual salespeople.
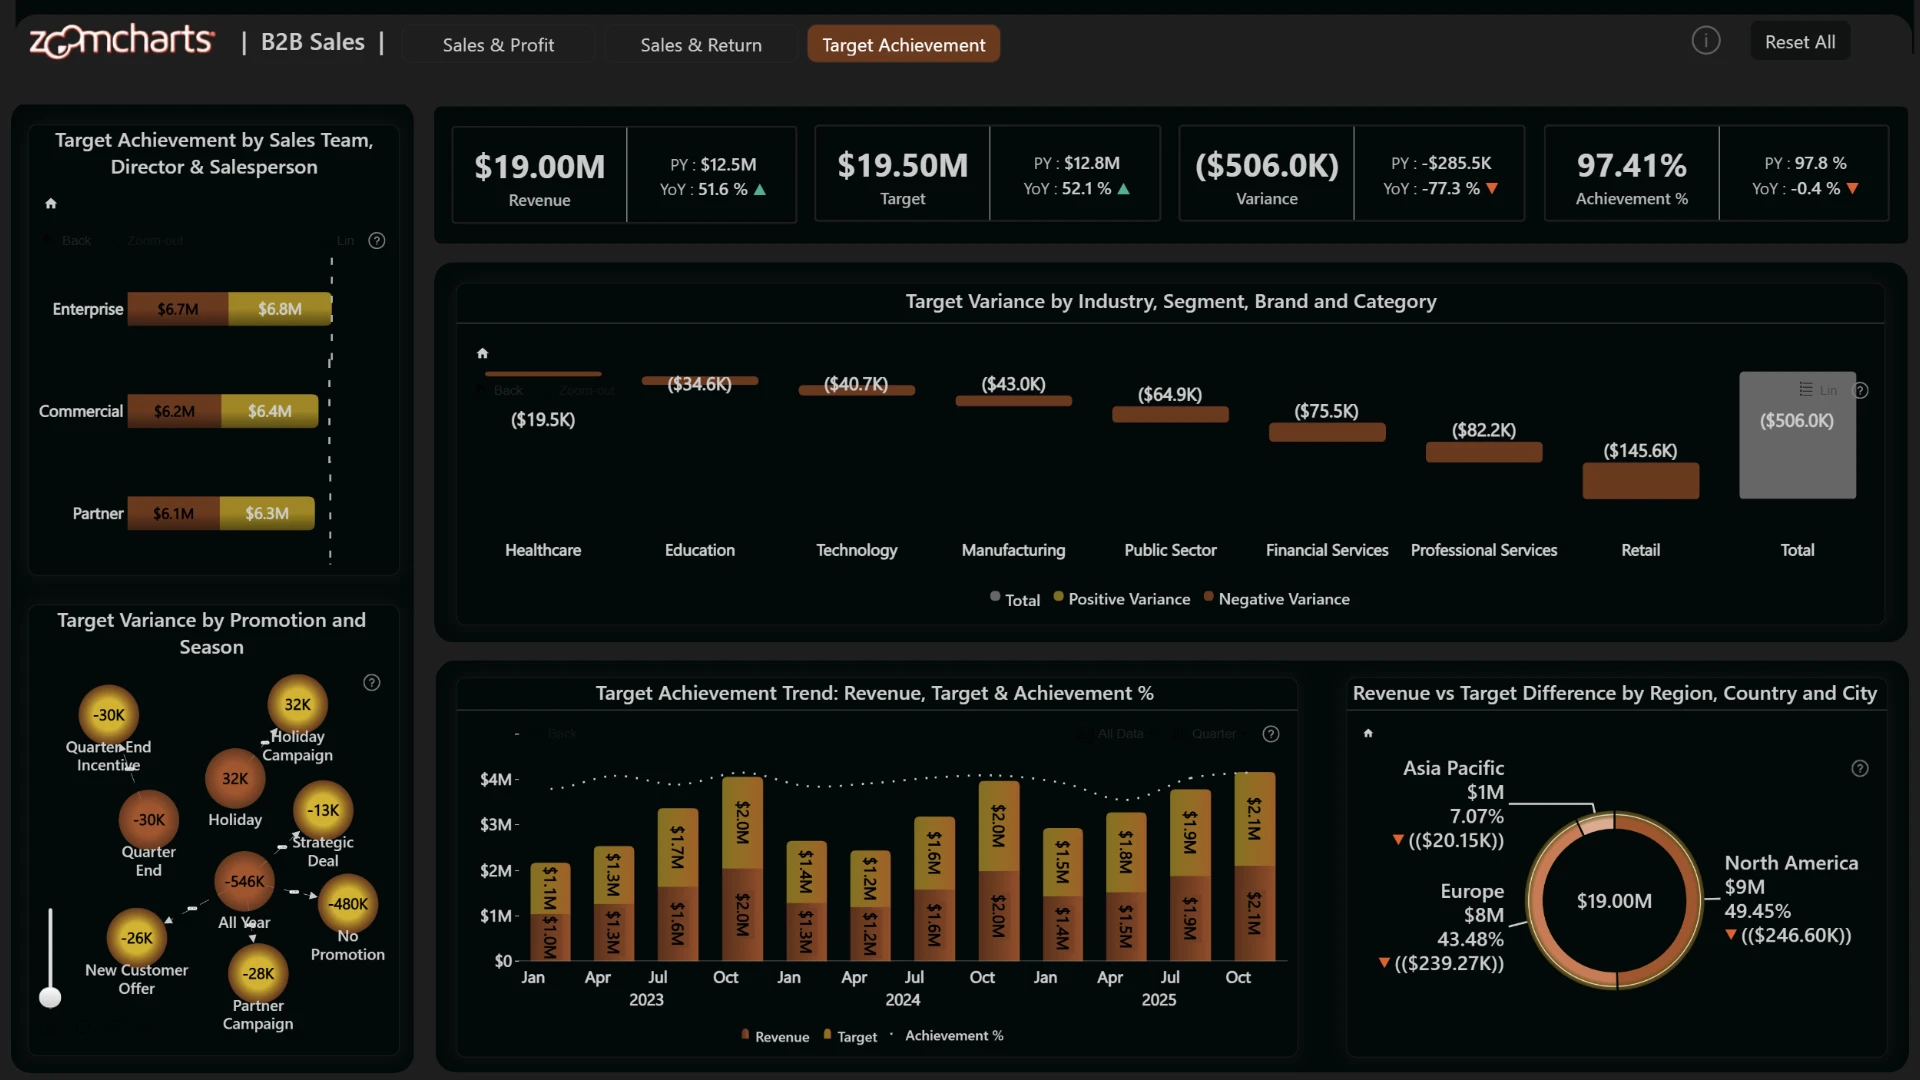
Target Achievement
The Target Achievement view compares actual Revenue against sales targets and highlights where performance is above or below expectations.
- Track overall Revenue, Target, Variance, and Achievement %.
- Compare target performance across sales teams, directors, and salespeople.
- Analyze Target Variance across industry, customer segment, brand, and category.
- Explore how promotions and seasonal campaigns contribute to positive or negative target variance.
- Compare Revenue and Target performance by region, country, and city.
- Follow the historical trend of Revenue, Target, and Achievement % over time.
Interactive Exploration
Built with ZoomCharts Drill Down visuals, the report allows users to move from high-level KPIs into progressively more detailed views without leaving the dashboard.
- Drill from region to country and city.
- Explore industry, segment, brand, category, and subcategory hierarchies.
- Analyze performance from sales team to individual salesperson.
- Cross-filter visuals to investigate specific products, promotions, channels, and periods.
- Use scenario controls to explore potential changes in Return Rate and their financial impact.
ZoomCharts visuals used







4U Report Challenges
Participate in data challenges, build and submit reports to get free template downloads.
Join CommunityMobile view allows you to interact with the report. To Download the template please switch to desktop view.



How to use a PBIX template
Preview the interactive report, download the PBIX file, open it in Power BI Desktop, and replace the same data connection with your own dataset.
Preview and download
Explore the report online and download the PBIX template file.
Open in Power BI Desktop
Open the downloaded PBIX file in Power BI Desktop.
Connect your data
Replace the sample data source with your own dataset.
Refresh and adjust
Refresh the model and update fields or visual were needed.
Save and share
Save your report and publish it for your audience.


