329
Power BI Sales by Product Dashboard
Power BI Sales by Product Dashboard
More Report pages
Report Author: Mohan Kumar
329
Share template with others
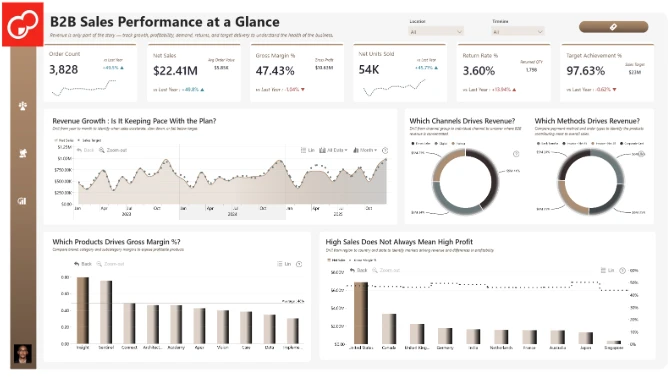
Page 1: Performance Overview
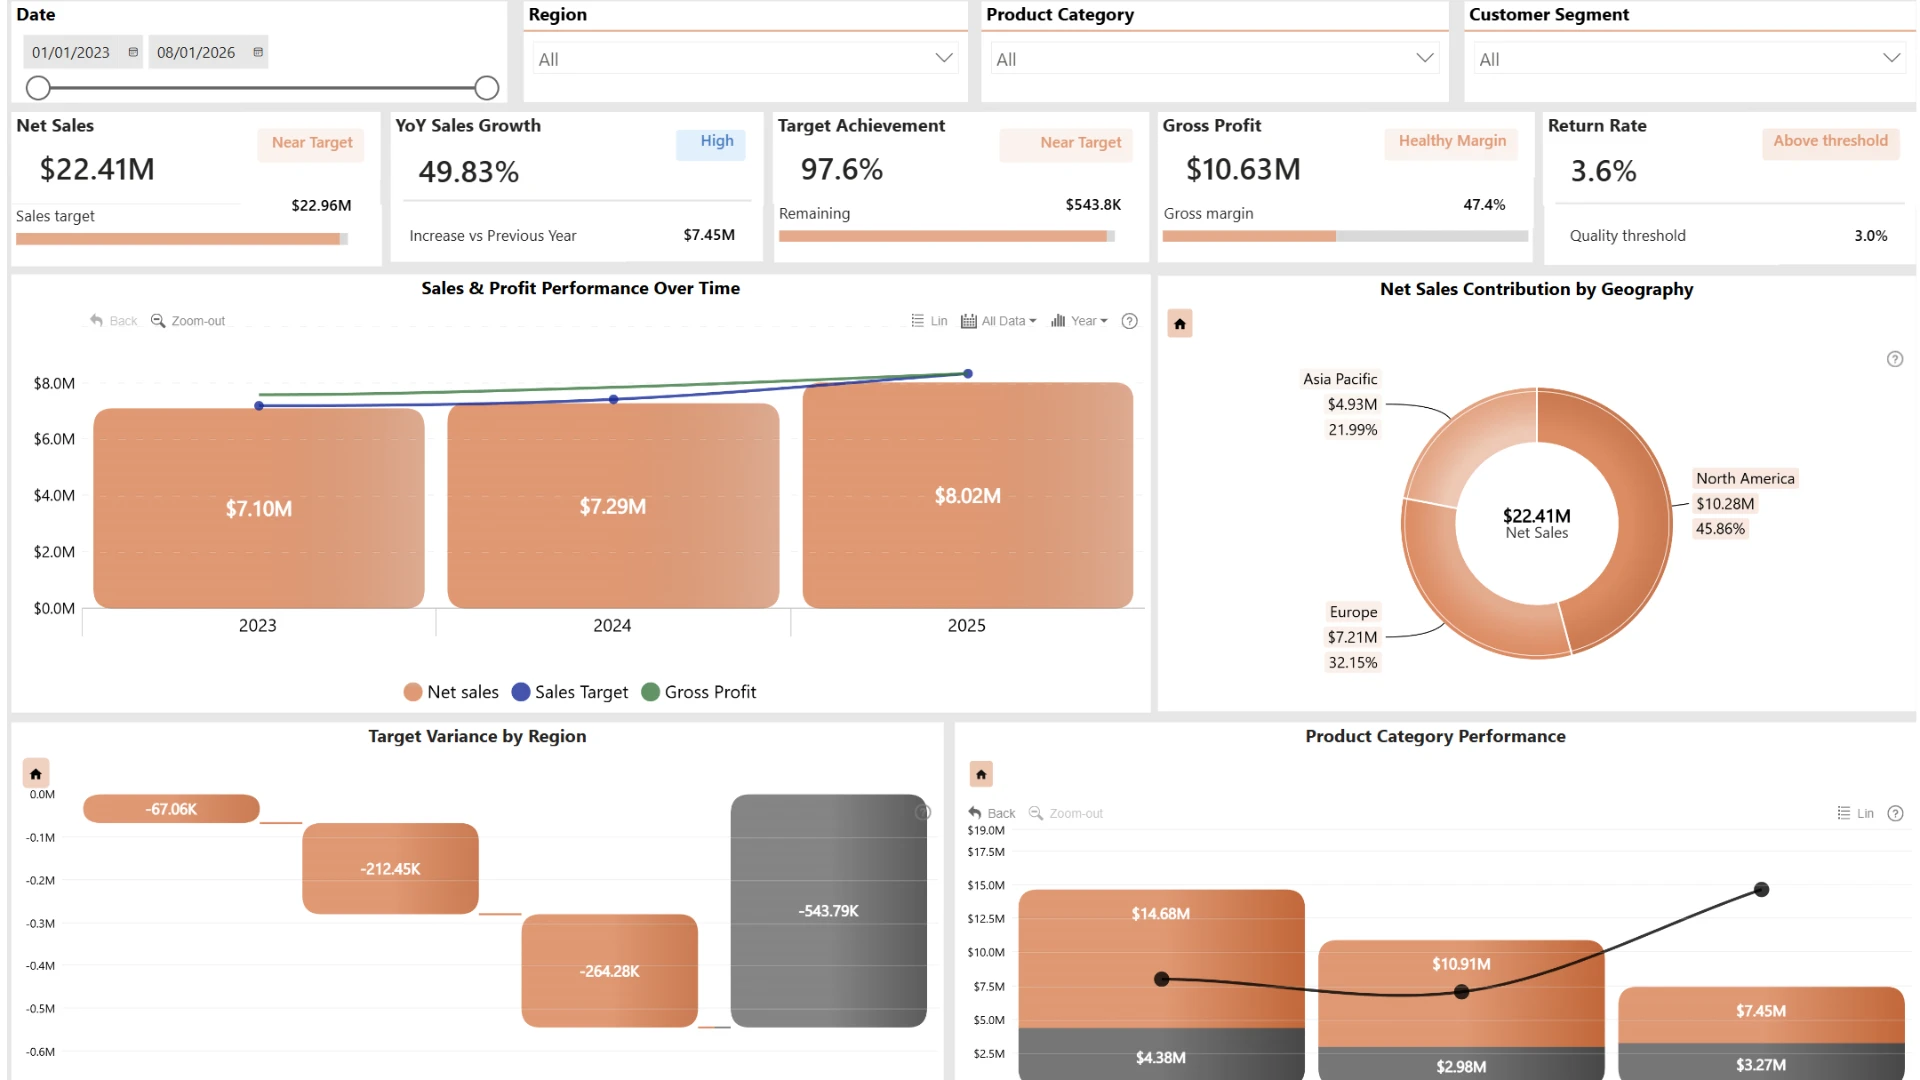
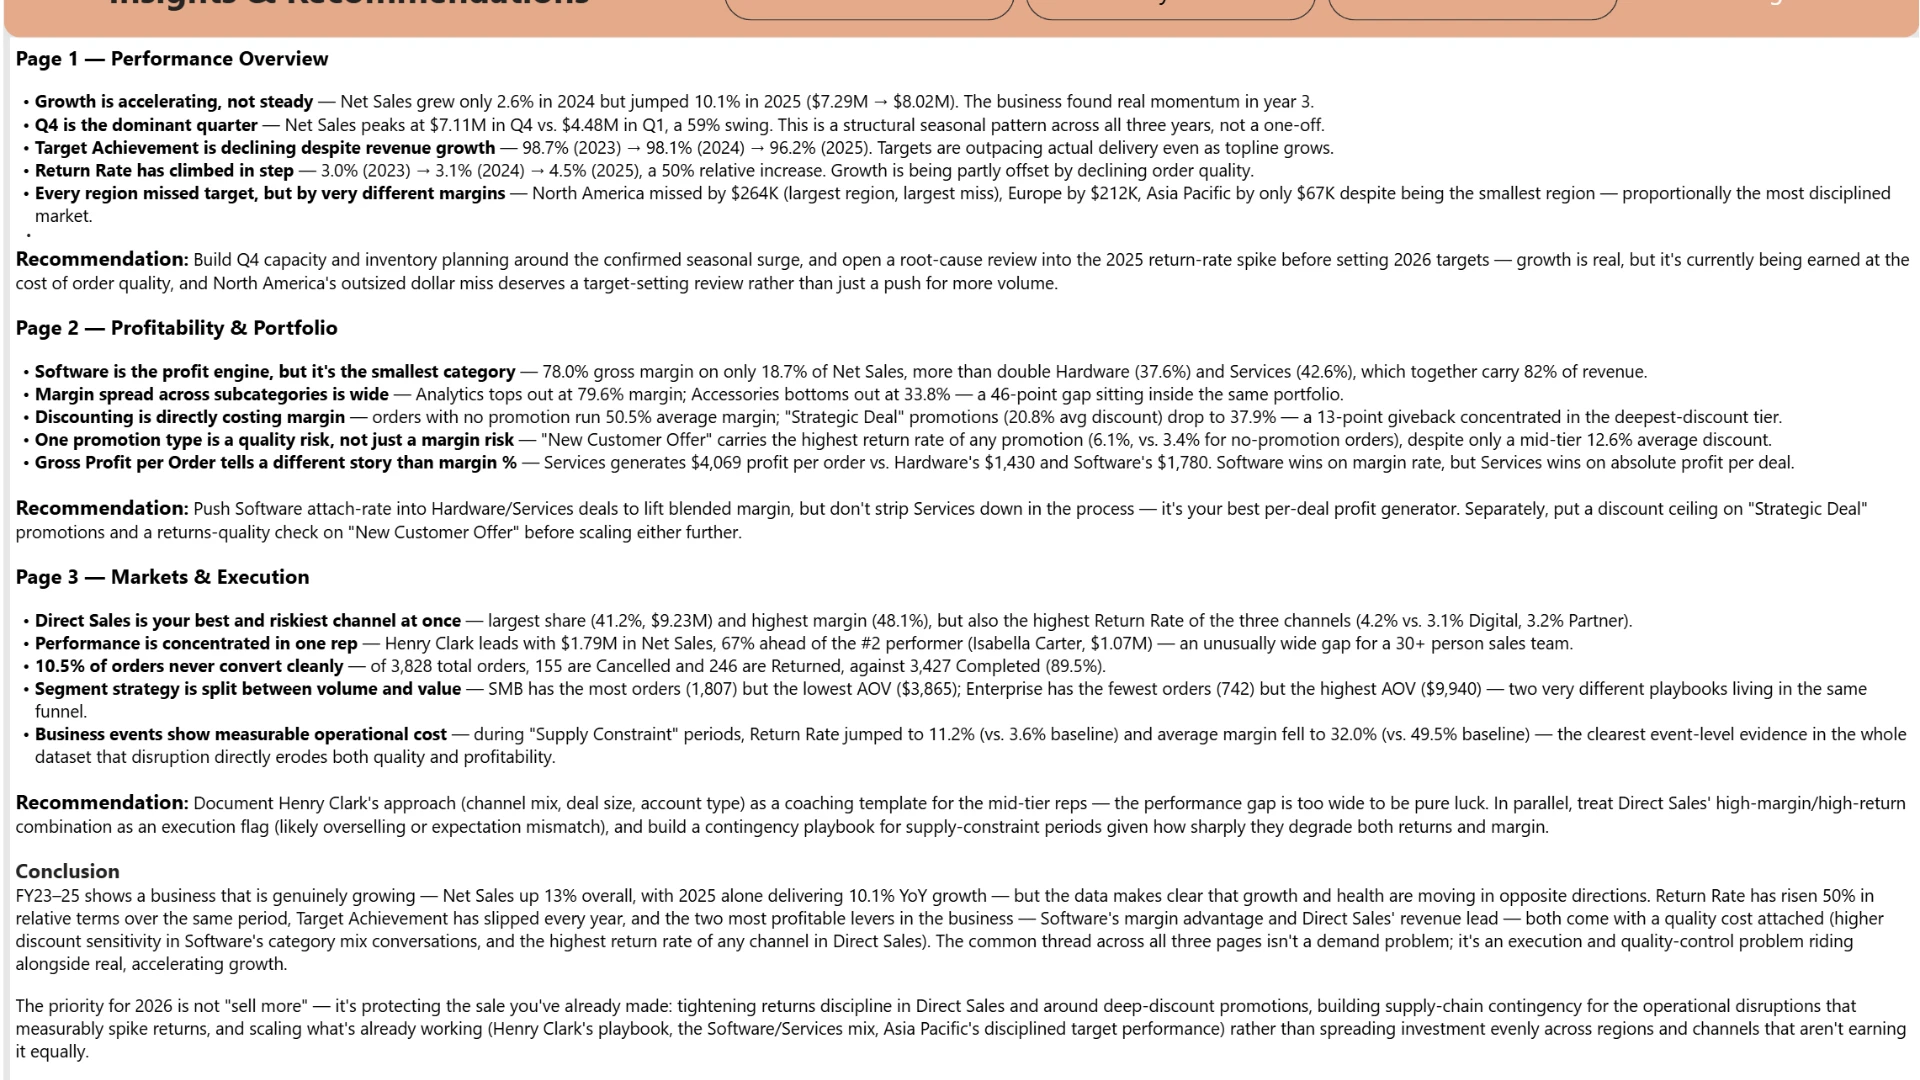
- Growth accelerated in 2025. Net Sales increased 10.1% YoY, rising from $7.29M to $8.02M after only 2.6% growth in 2024.
- Q4 drives the business. Q4 generated $7.11M in Net Sales, which is 59% more than Q1, confirming a strong recurring seasonal pattern.
- Target performance is slipping. Target Achievement declined for three consecutive years: 98.7% → 98.1% → 96.2%.
- Returns are becoming a bigger problem. Return Rate increased from 3.0% to 4.5%, representing a 50% relative increase since 2023.
- Regional performance varies significantly. North America missed target by $264K, Europe by $212K, while Asia Pacific missed by only $67K.
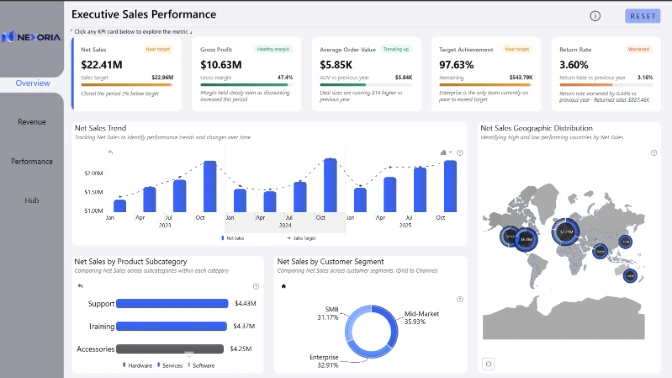
Page 2: Profitability & Portfolio
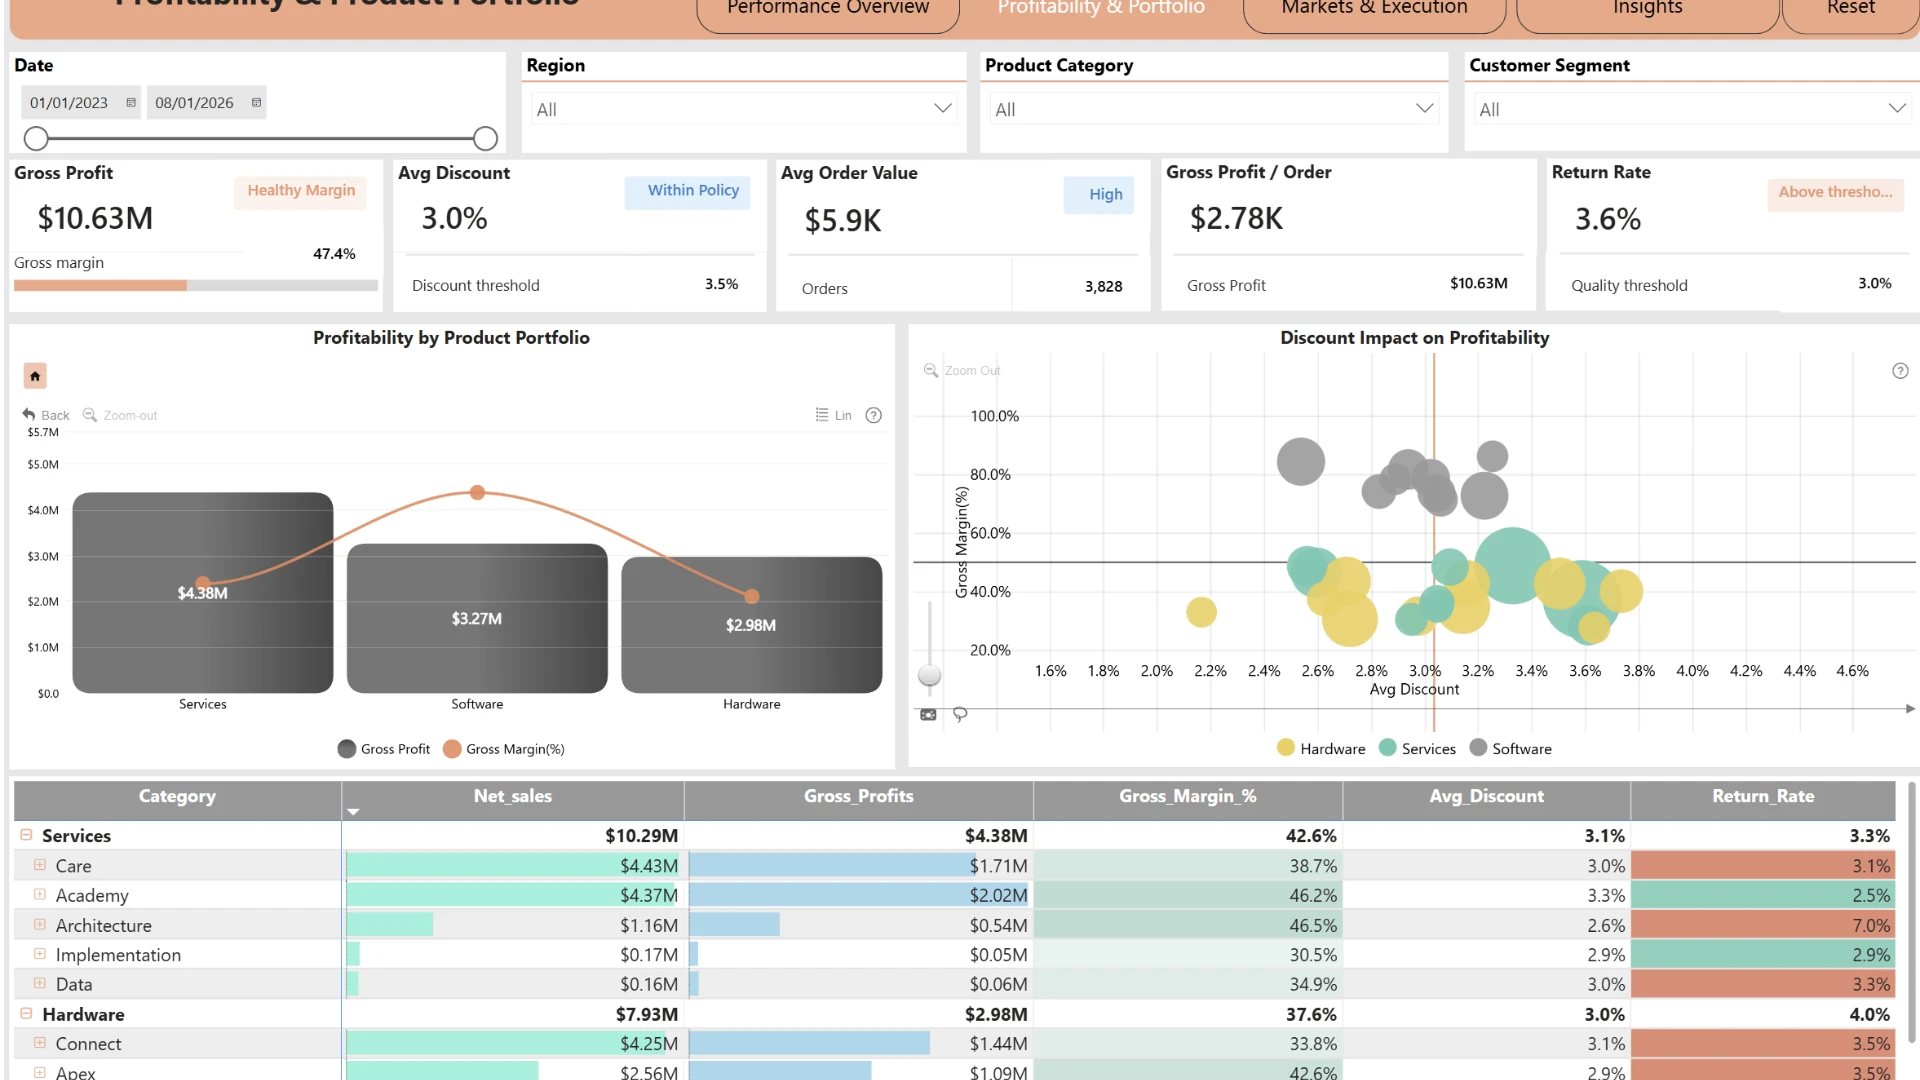
- Software is the profit engine, but it is the smallest category. Software delivers a 78.0% gross margin while accounting for only 18.7% of Net Sales. Its margin is more than double Hardware at 37.6% and well above Services at 42.6%.
- Margins vary significantly across subcategories. Analytics reaches a 79.6% margin, while Accessories falls to 33.8%, creating a gap of almost 46 percentage points.
- Discounting has a direct impact on profitability. Orders without promotions achieve a 50.5% average margin. Strategic Deal promotions average a 20.8% discount and reduce margin to 37.9%.
- New Customer Offers create a return risk. This promotion type has the highest Return Rate at 6.1%, compared with 3.4% for orders without a promotion.
- Services generate the highest profit per order. Services produce $4,069 Gross Profit per Order, compared with $1,430 for Hardware and $1,780 for Software.
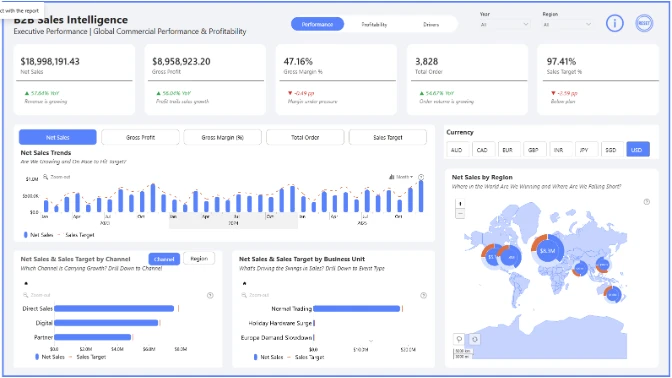
Page 3: Markets & Execution
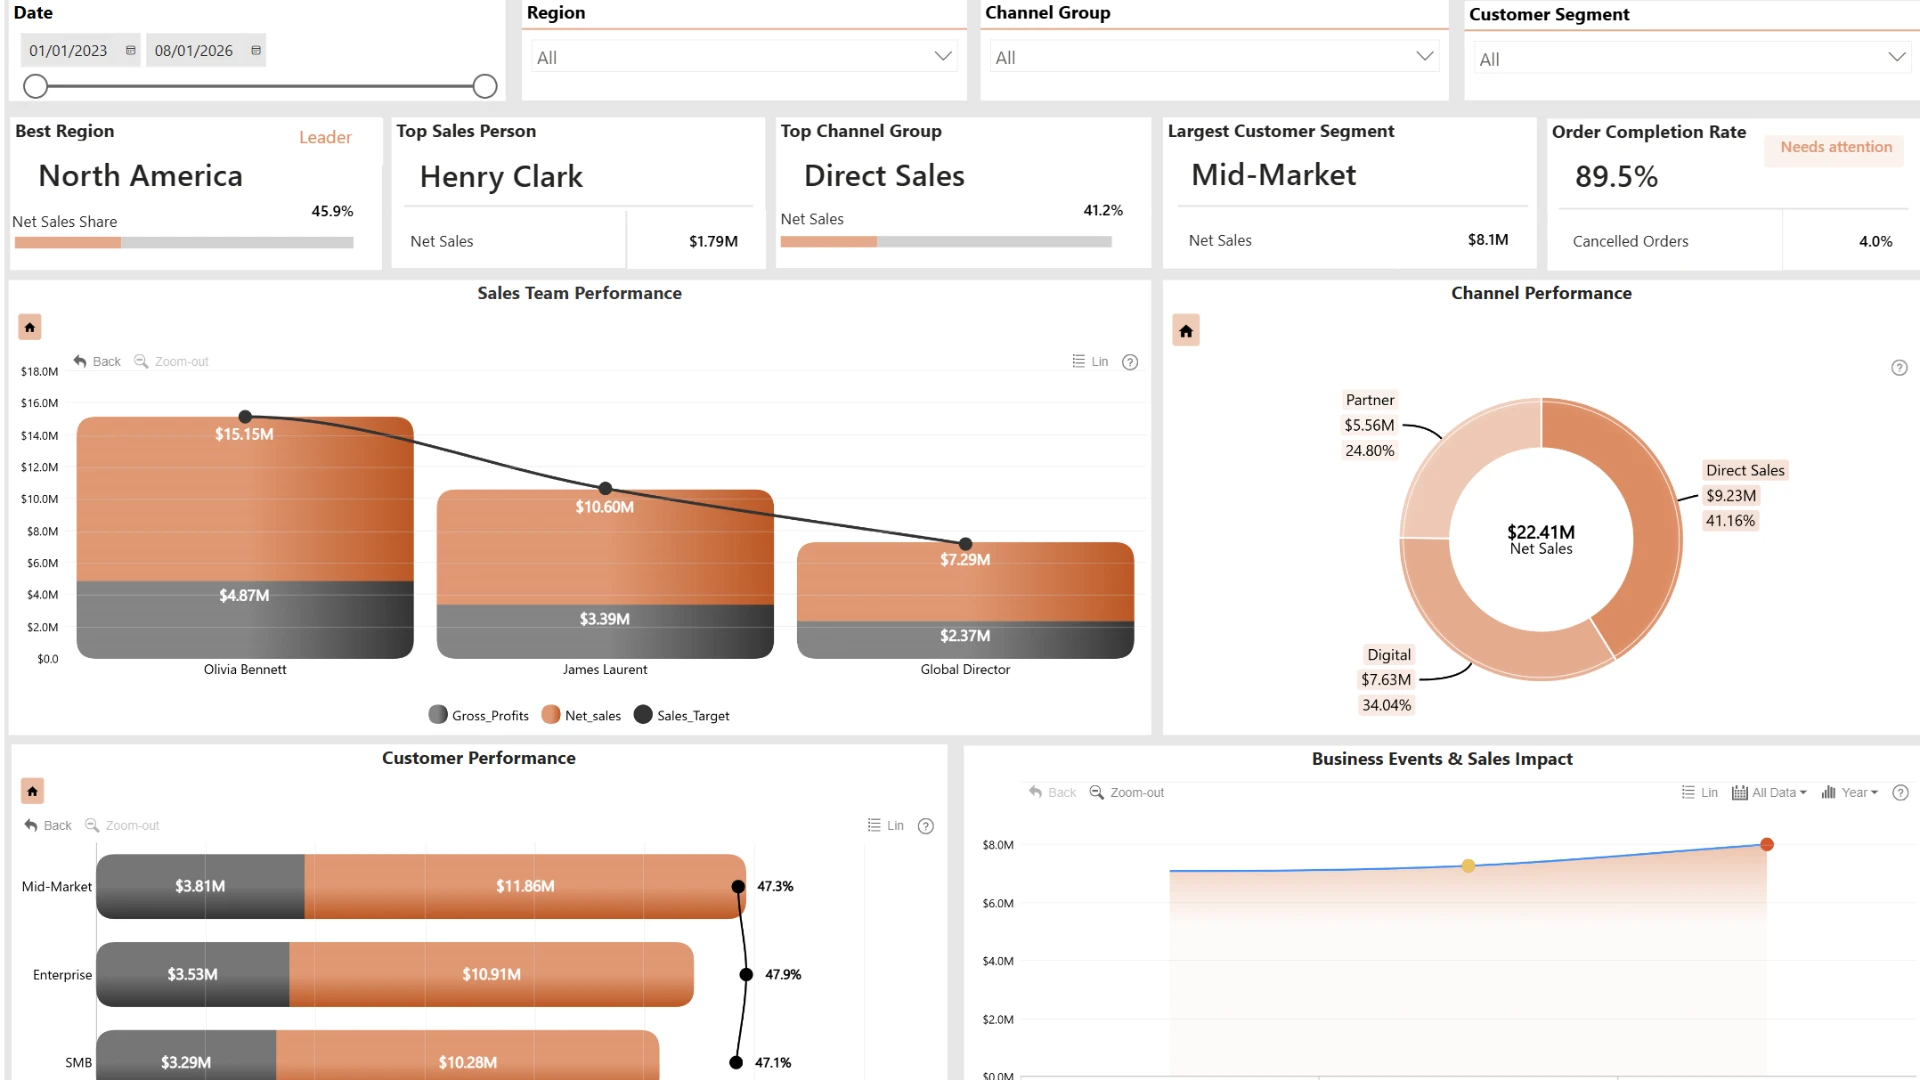
- Direct Sales is both the strongest and riskiest channel. It generates the largest share of Net Sales at 41.2%, or $9.23M, and the highest margin at 48.1%, but it also has the highest Return Rate at 4.2%.
- Sales performance is heavily concentrated in one representative. Henry Clark leads with $1.79M in Net Sales, which is 67% higher than Isabella Carter at $1.07M.
- 10.5% of orders do not convert into completed sales. Of 3,828 total orders, 155 were cancelled and 246 were returned, leaving 3,427 completed orders.
- SMB drives volume, while Enterprise drives value. SMB generates the most orders at 1,807, but has the lowest Average Order Value at $3,865. Enterprise has only 742 orders, but the highest Average Order Value at $9,940.
- Supply constraints have a major impact on performance. During Supply Constraint periods, Return Rate increased to 11.2% compared with a 3.6% baseline, while average margin dropped to 32.0% from 49.5%.
Conclusion
Priorities for 2026
- Reduce returns in Direct Sales and high-risk promotion types.
- Prepare inventory and capacity for the recurring Q4 sales peak.
- Protect margins by reviewing discount levels and promotional performance.
- Increase Software attachment to Hardware and Services deals.
- Replicate the sales practices of top-performing representatives across the wider team.
- Build contingency plans for supply constraints and other operational disruptions.
ZoomCharts visuals used






4U Report Challenges
Participate in data challenges, build and submit reports to get free template downloads.
Join CommunityMobile view allows you to interact with the report. To Download the template please switch to desktop view.
How to use a PBIX template
Preview the interactive report, download the PBIX file, open it in Power BI Desktop, and replace the same data connection with your own dataset.
Preview and download
Explore the report online and download the PBIX template file.
Open in Power BI Desktop
Open the downloaded PBIX file in Power BI Desktop.
Connect your data
Replace the sample data source with your own dataset.
Refresh and adjust
Refresh the model and update fields or visual were needed.
Save and share
Save your report and publish it for your audience.


