logo
For Power BI
  • Products
    • Custom Visuals for Power BI
    • Report Templates
  • Resources

      Resources

    • Documentation
    • Report Examples
    • Blog
    • Webinars
    • Video Tutorials
    • Visuals Gallery

    Support

    • ZoomCharts Assistance
    • Contact Sales
    • Contact Support
    • FAQ

    Challenges

    Challenges

    Improve your report creation skills by participating in free challenges for report creators.

    Learn more
    Get Developer License
  • Services
    • Power BI Report Development
    • Custom Visual Development
  • Challenges
  • Pricing
Get started
Get started
Get it now
Go back

Contents

Dashboard and report examples Power BI Real Estate Dashboard for Market Analytics

20655

Power BI Real Estate Dashboard for Market Analytics

Power BI Real Estate Dashboard for Market Analytics

Report
Report

More Report pages

Report
Report
Report
Report
Report Interact

Report Author: ZoomCharts

20655

Timeline Map Donut Real Estate

Share template with others

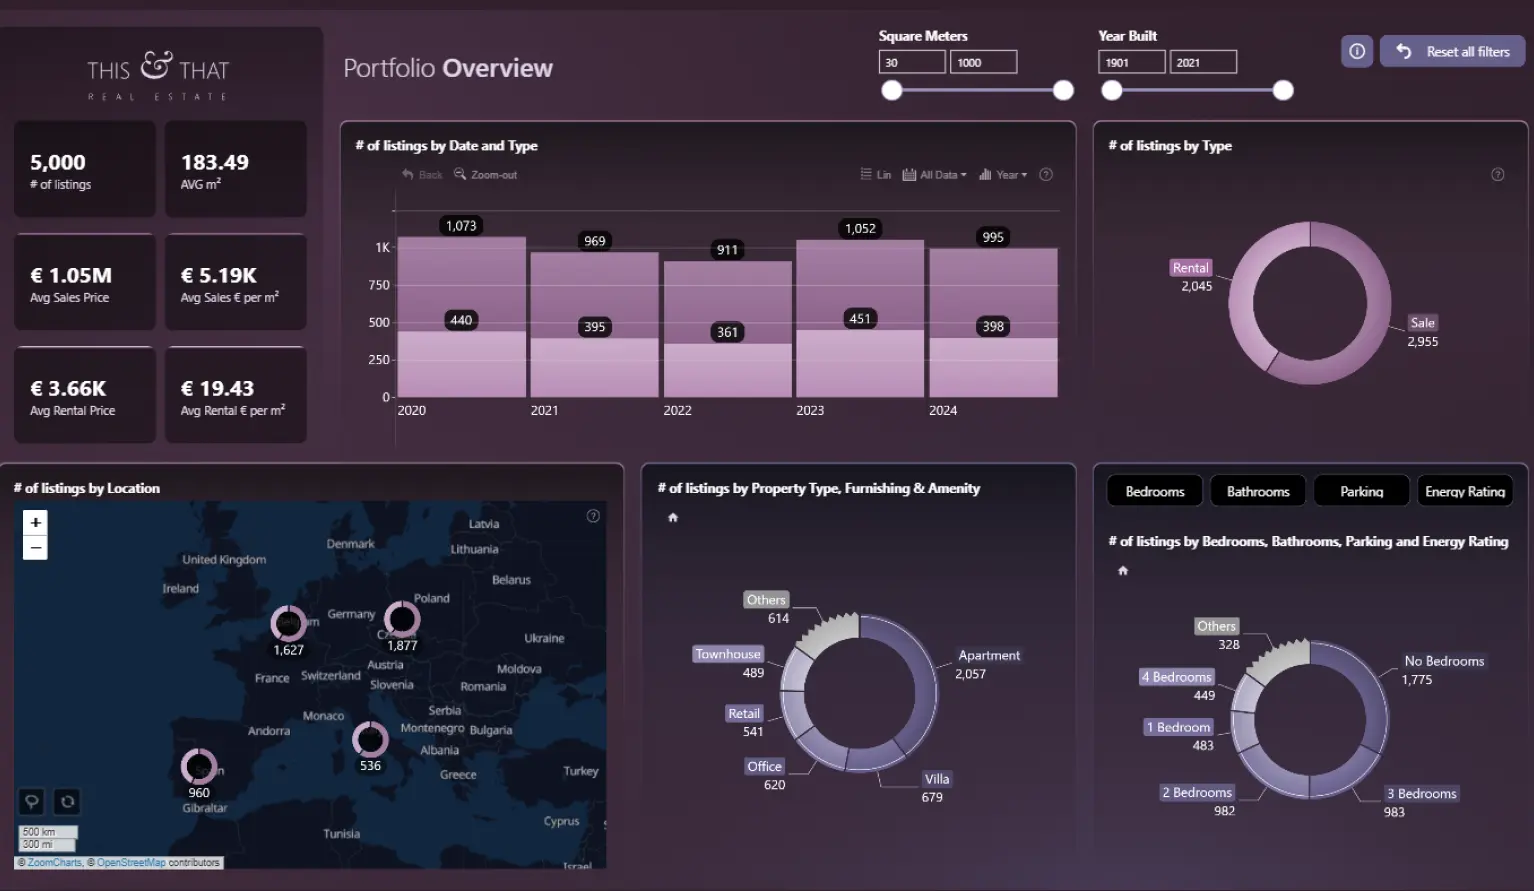
This interactive Power BI real estate dashboard template explores property listings and market analytics to help real estate agencies, property platforms, investors, and analysts monitor property prices, listing activity, and portfolio performance across locations, property types, and time.

The report provides a clear overview of real estate market trends, pricing insights, and property distribution, enabling users to compare locations, evaluate investment opportunities, and understand how property characteristics impact value. It is ideal for analyzing European real estate markets, but can be adapted to any regional or global dataset.


Use this Power BI real estate dashboard to:

  • Track total property listings and portfolio size
  • Monitor average sales price, rental price, and price per square meter
  • Analyze listing trends over time by year and property type
  • Compare rental vs sale distribution across the market
  • Explore property distribution across cities, countries, and regions
  • Understand how property type, size, furnishing, and amenities impact pricing
  • Analyze property characteristics such as bedrooms, bathrooms, parking, and energy rating
  • Identify high-demand locations and investment opportunities

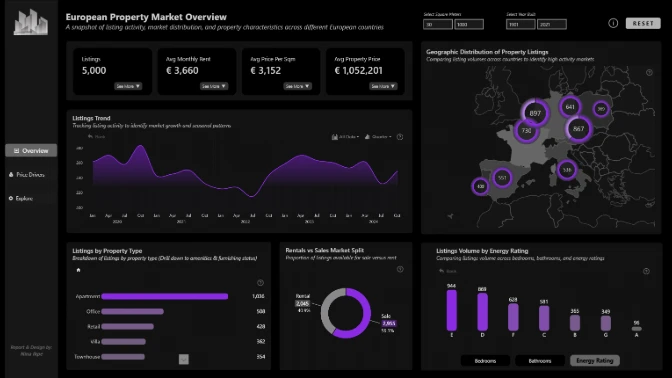
Key pages and insights included:

  • Portfolio Overview with KPI cards for total listings, average property size, sales price, and rental metrics
  • Listings trend analysis by year and property type
  • Geographic map visualization showing listing distribution across European countries
  • Property type and amenity breakdown for understanding market composition
  • Bedrooms, bathrooms, and energy rating analysis for evaluating property features
  • Rental vs sale market split to compare listing types

Real estate KPIs included:

  • Total listings
  • Average property size (m²)
  • Average sales price
  • Average price per m²
  • Average rental price
  • Rental price per m²
  • Listings by property type
  • Rental vs sale share
  • Listings by location and region
  • Property characteristics (bedrooms, bathrooms, parking, energy rating)

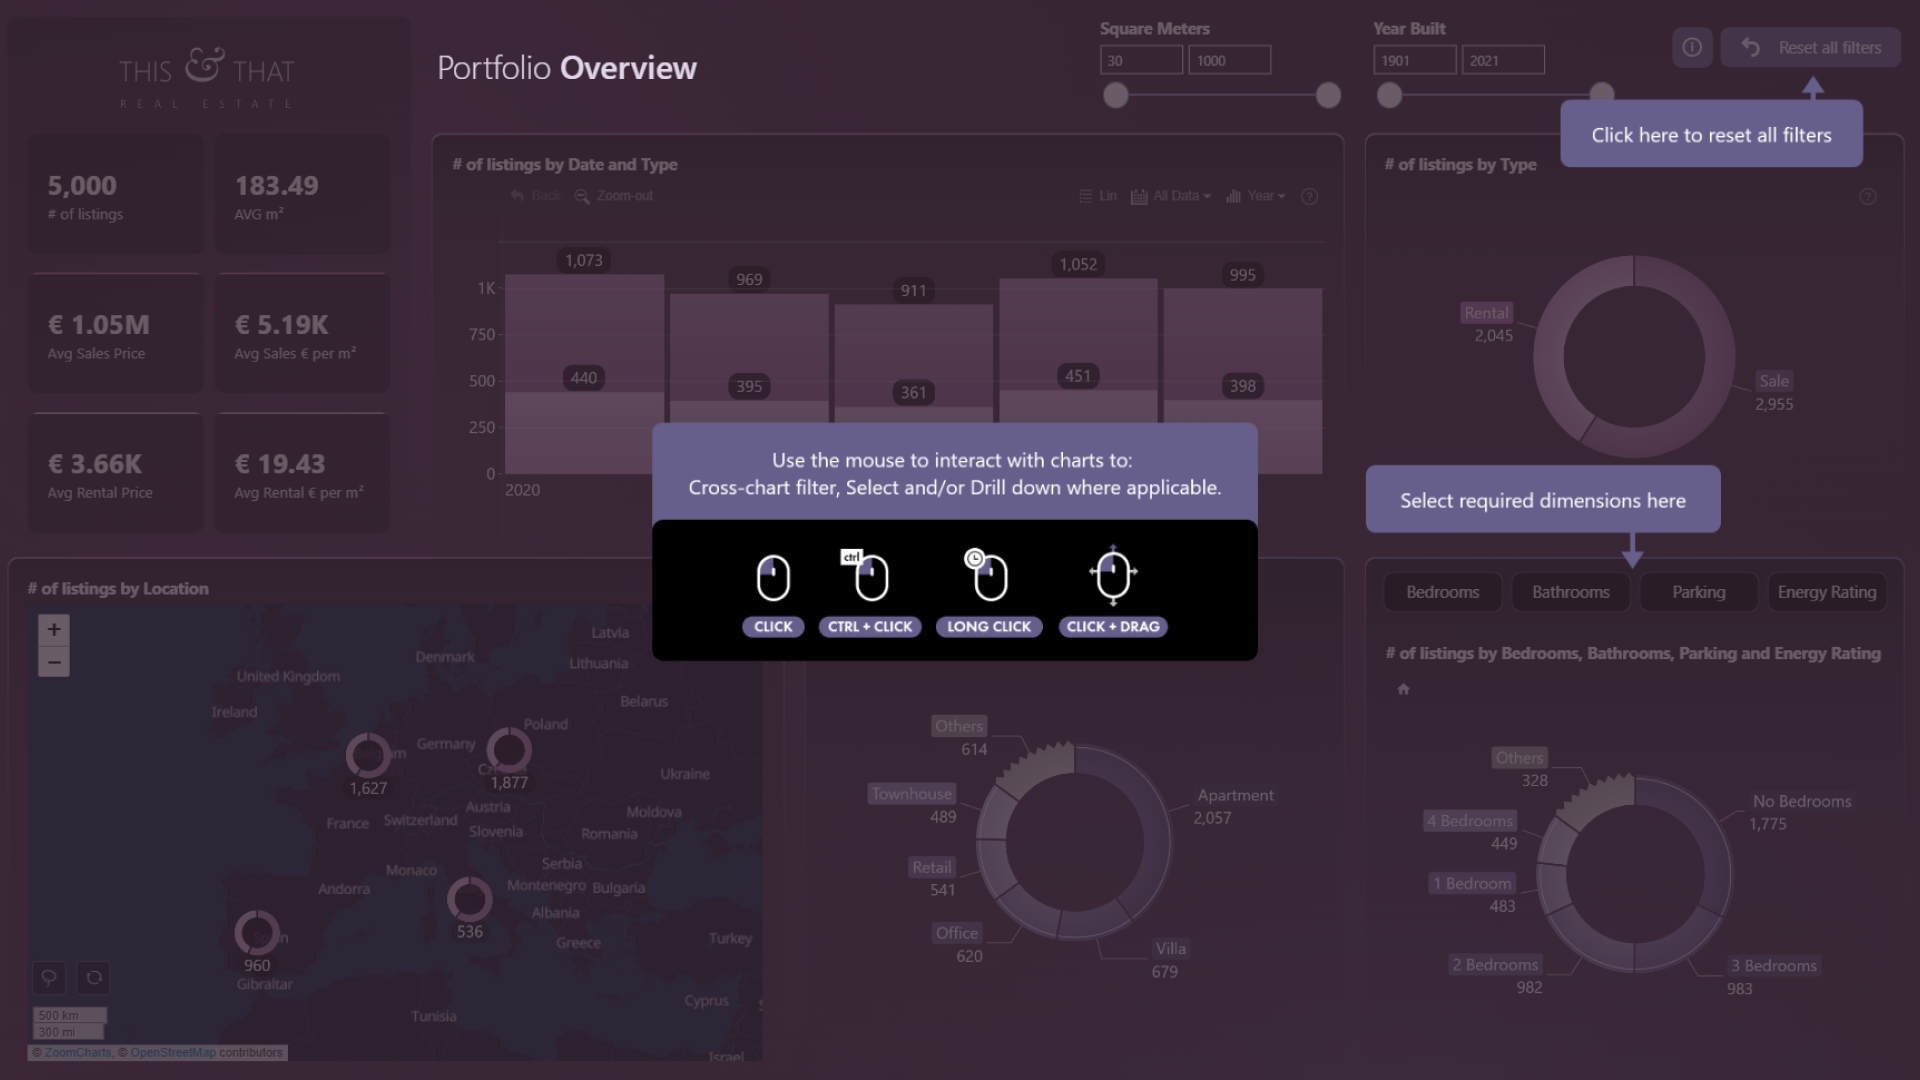
Interactive Power BI features:

  • Drill-down from portfolio overview to property-level insights
  • Cross-filtering across location, property type, listing type, and features
  • Interactive map for exploring geographic distribution of listings
  • Dynamic filtering by square meters, year built, and property attributes
  • Multi-dimensional analysis of real estate data using ZoomCharts visuals

Who this report is for:

  • Real estate agencies and brokerages
  • Property listing platforms and proptech companies
  • Real estate investors and portfolio managers
  • Housing market analysts and researchers
  • Valuation and consulting teams
  • Power BI developers building real estate dashboards

This Power BI real estate dashboard template is fully customizable in Power BI Desktop and can be adapted to property marketplace data, rental platforms, brokerage listings, and investment datasets. It is ideal for teams that need a real estate analytics dashboard, property pricing report, or housing market analysis tool to monitor trends, compare regions, and support smarter investment decisions.


Author:ZC

ZoomCharts visuals used

Drill Down Map PRO Drill Down Map PRO
Drill Down Timeline PRO Drill Down Timeline PRO
Drill Down Donut PRO Drill Down Donut PRO

Need help?

Send your question to ZoomCharts assistant, and we will respond to you as soon as possible.

Contact Us

Mobile view allows you to interact with the report. To Download the template please switch to desktop view.

Similar reports

All Reports6 results
New
Report Card

Power BI Real Estate Dashboard for Property Listings and Pricing Analysis

2115

New
Report Card

Real Estate Listings & Pricing Explorer 2

766

New
Report Card

Real Estate Analytics Power BI Dashboard 4

157

Explore all reports

Was this helpful? Thank you for your feedback!

Sorry about that.

How can we improve it?

Power BI Real Estate Dashboard for Market Analytics

Report Author: ZoomCharts

20655

ZoomCharts

Welcome to ZoomCharts

You’re almost there! Create an account to download reports.

or
Sign up with Microsoft

Verify your email address

We have sent a code to your email address. Please input the code below.

Didn't receive code? Request again (after 30 seconds)

Already have an account? Log in

ZoomCharts

Log in to your ZoomCharts account

Log in with Microsoft
or
Forgot password?

Reset your password

We'll email you instructions on how to reset your password

Don't have an account? Sign up

Please add credits

You have 0 available downloads.
Get more credits or upgrade your plan to continue.

View pricing
logo
[email protected]
+44 204 577 3993
logo

Products

Drill Down Bubble PRO Drill Down Line PRO Drill Down Network PRO Drill Down Waterfall PRO Drill Down Graph PRO Drill Down Combo PRO Drill Down Combo Bar PRO Drill Down Donut PRO Drill Down Pie PRO Drill Down TimeSeries PRO Drill Down Timeline PRO Drill Down Map PRO Drill Down Scatter PRO All Visuals

Resources

Report Examples Webinars Blog ZoomCharts Academy Visuals Gallery Documentation Custom Visual Development Subscribe to News

Solutions

Custom Visual Development

Company

Pricing About Us Partners Leave feedback Join PowerGroup EU Funding

Help

ZoomCharts Assistance Contact Sales Contact Support FAQ AI Information

Drill Down Line PRO Drill Down Bubble PRO Drill Down Network PRO Drill Down Waterfall PRO Drill Down Graph PRO Drill Down Combo PRO Drill Down Combo Bar PRO Drill Down Donut PRO Drill Down Pie PRO Drill Down TimeSeries PRO Drill Down Timeline PRO Drill Down Map PRO Drill Down Scatter PRO All Visuals

Report Examples Webinars Blog ZoomCharts Academy Visuals Gallery Documentation Custom Visual Development Subscribe to News

Custom Visual Development

Pricing About Us Partners Leave feedback Join PowerGroup EU Funding

ZoomCharts Assistance Contact Sales Contact Support FAQ AI Information
+44 204 577 3993
[email protected]

Ready to get in touch?

Contact our experts with any question about Power BI and ZoomCharts for Free!

Contact us

© 2026, Data Visualization Software Lab

U.S. Patents No. 11,645,343; 11,921,804; 12,346,389

Cookies
Privacy Policy
Global
Legal
Patent
warning

Error message

success

Success info: Done!

ZoomCharts AI Assistant

We noticed you're using an old OS version.

For the best experience, we recommend upgrading to ensure that all website features display correctly.

Cookie settings

We use necessary cookies for site functionality, as well as statistic, marketing, and preference cookies to enhance your experience. For more information and to manage your preferences, please visit our Cookie policy