521
Power BI Procurement Analytics Dashboard 2
Power BI Procurement Analytics Dashboard 2
More Report pages
Report Author: Crystal Andrea Dsouza
521
Share template with others
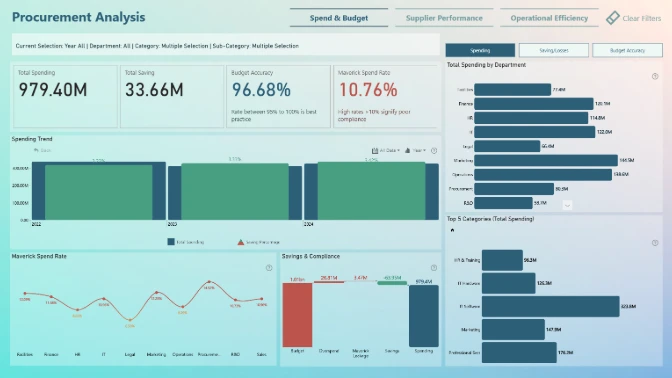
This interactive Power BI report explores the Procurement dataset using ZoomCharts Drill Down custom visuals and native Power BI visuals. It analyzes purchase order activity from 2022 to 2024, highlighting procurement spend, supplier performance, budget versus actuals, savings, delivery timelines, supplier risk, and maverick spend across categories, departments, regions, and suppliers.
The report helps users identify spending trends, compare supplier performance, monitor compliance, evaluate budget pressure, and uncover opportunities to improve procurement efficiency, reduce risk, and support better purchasing decisions.
The report was submitted to the FP20 Analytics ZoomCharts Data Challenge 37 (April-May 2026).
Author’s Description:
Dark theme with gold ZoomCharts gradients and fully interactive drill-down visuals across the report.
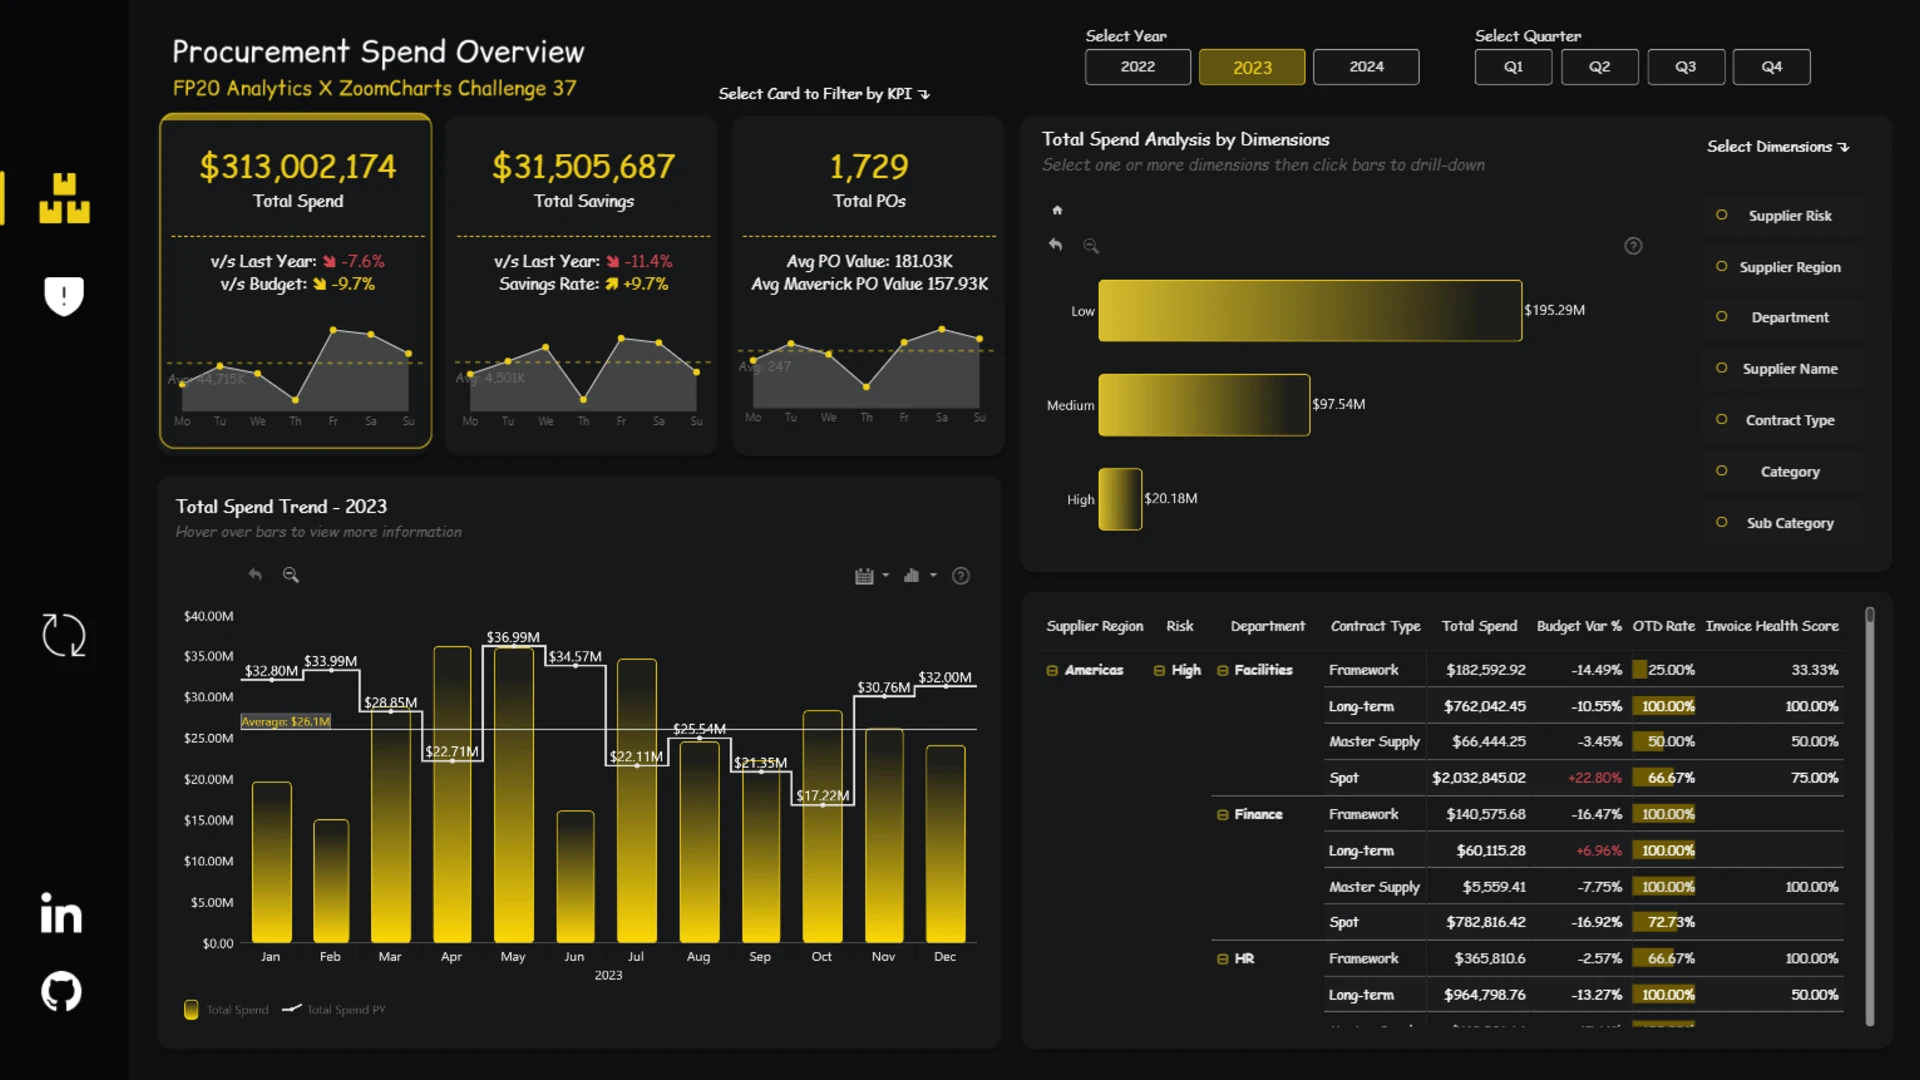
Procurement Spend Overview: Focused on answering one key question: where is the money going?
• KPI cards for Total Spend, Savings, and POs dynamically control the entire page
• Monthly spend vs. prior year analysis with reference lines
• Dynamic breakdowns by Supplier, Region, Category, Department, and more
• Supplier matrix with conditional formatting for OTD Rate and Invoice Health
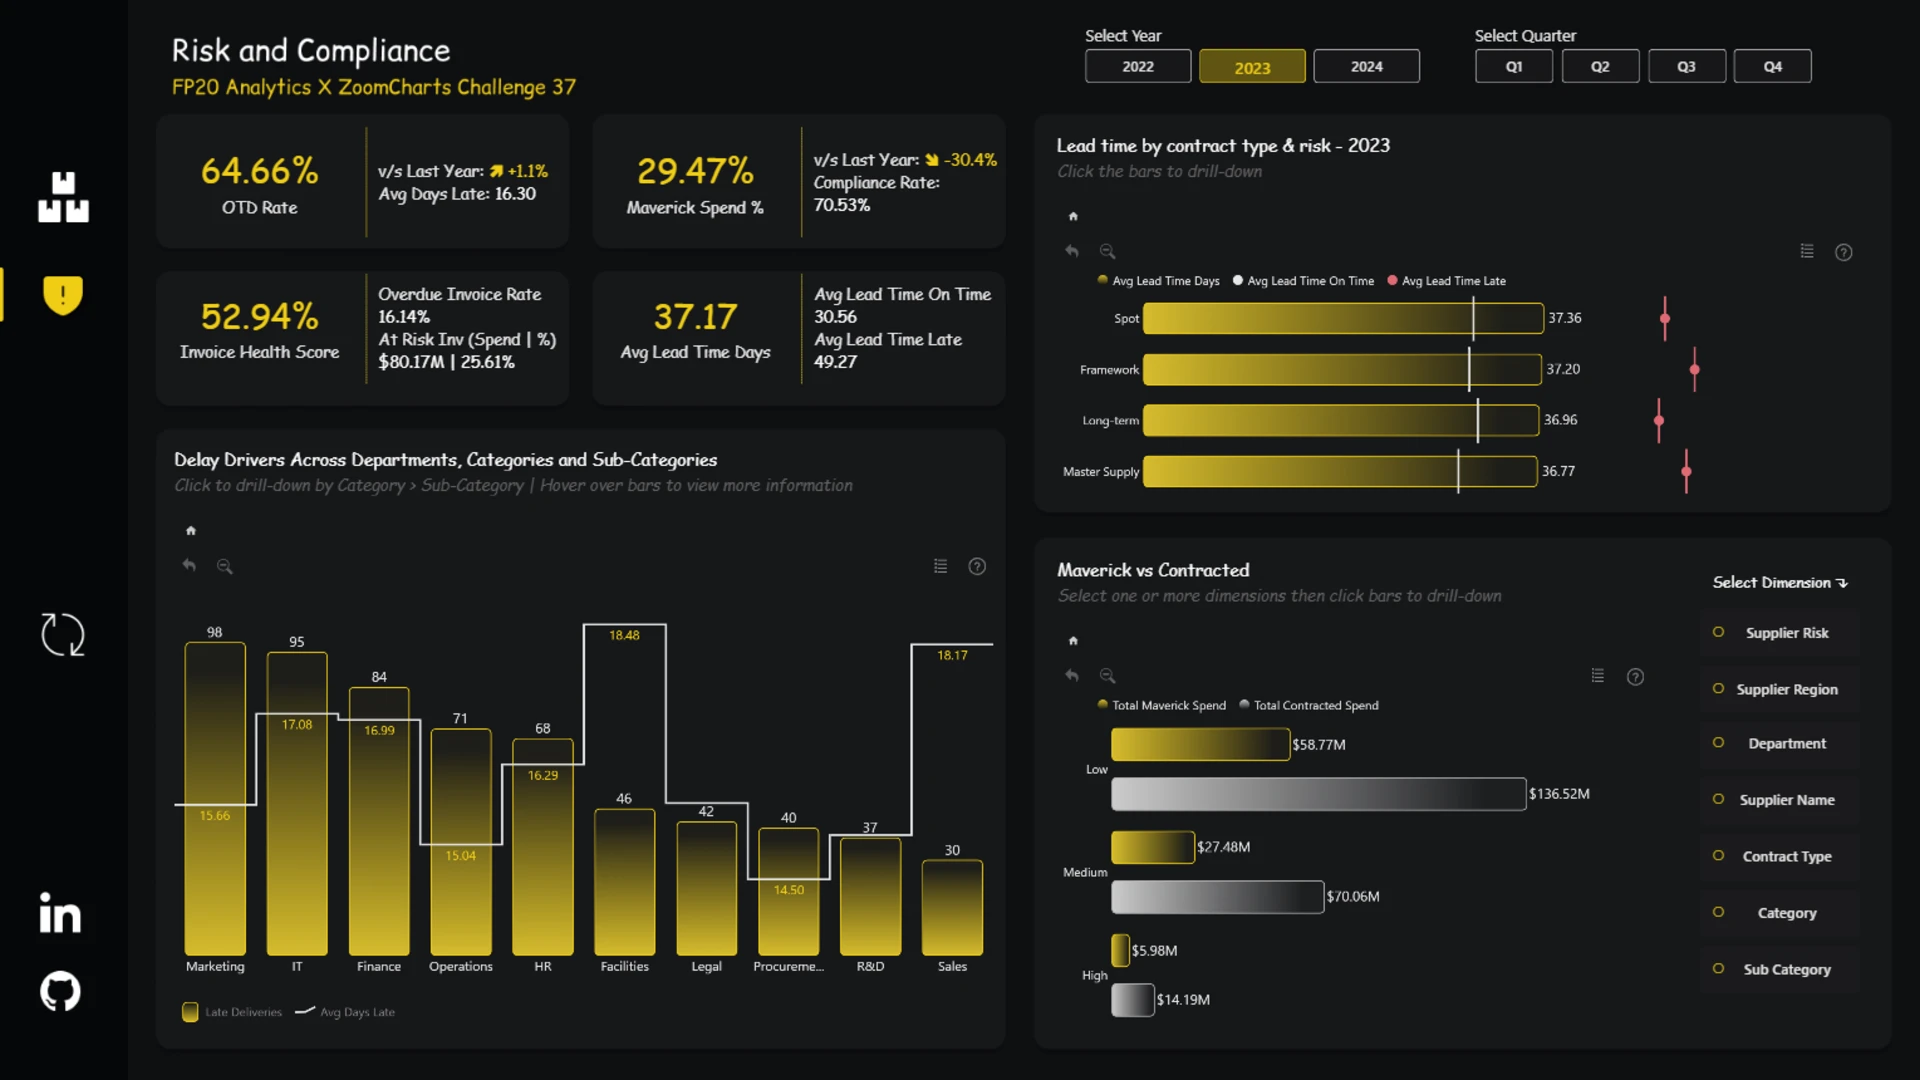
Risk & Compliance: Focused on identifying where procurement risks are hidden.
• KPI cards for OTD Rate, Maverick Spend %, Invoice Health Score, and Lead Time
• Delay analysis with drill-down capability
• Contract type vs. supplier risk comparison
• Maverick vs. contracted spend analysis across business dimensions
4U Report Challenges
Participate in data challenges, build and submit reports to get free template downloads.
Join CommunityMobile view allows you to interact with the report. To Download the template please switch to desktop view.
Was this helpful? Thank you for your feedback!
Sorry about that.
How can we improve it?