568
Power BI Operations Analytics Dashboard
Power BI Operations Analytics Dashboard
More Report pages
Report Author: Suleman Abdulmalik
568
Share template with others
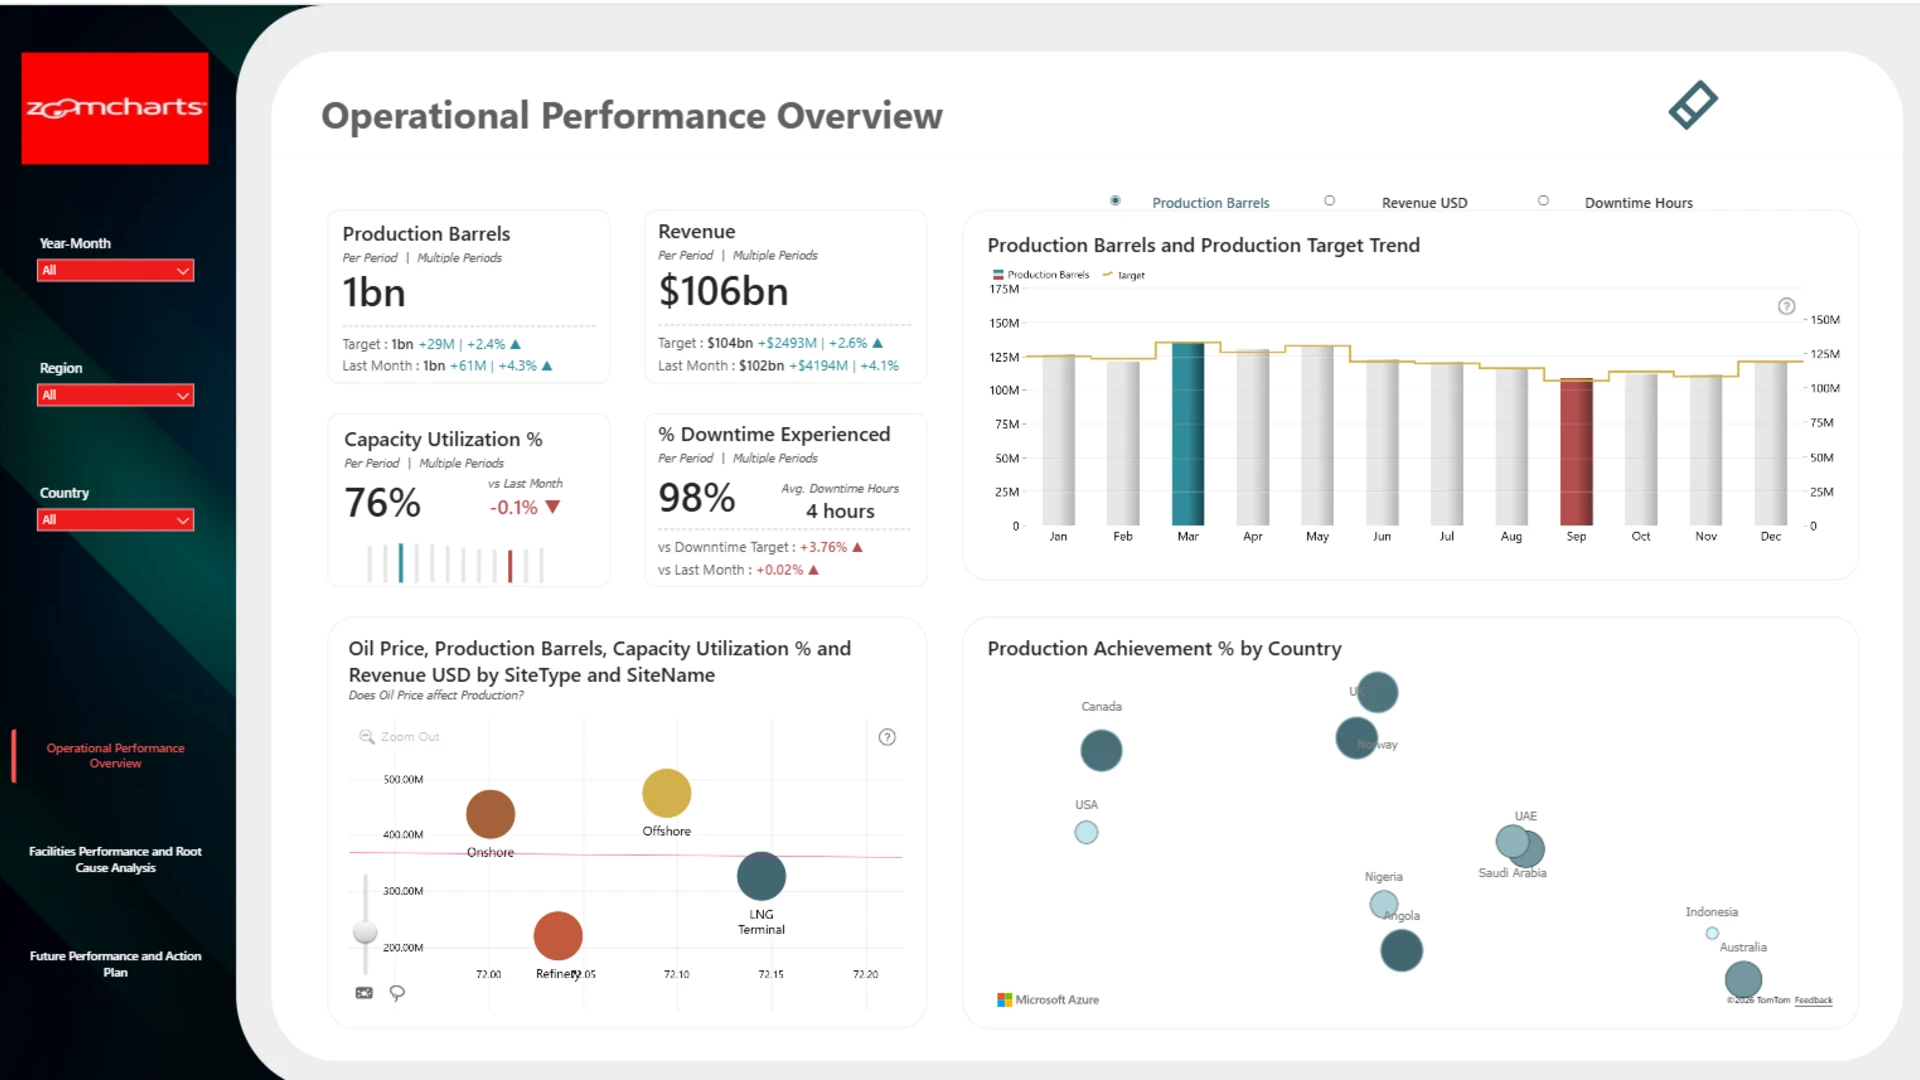
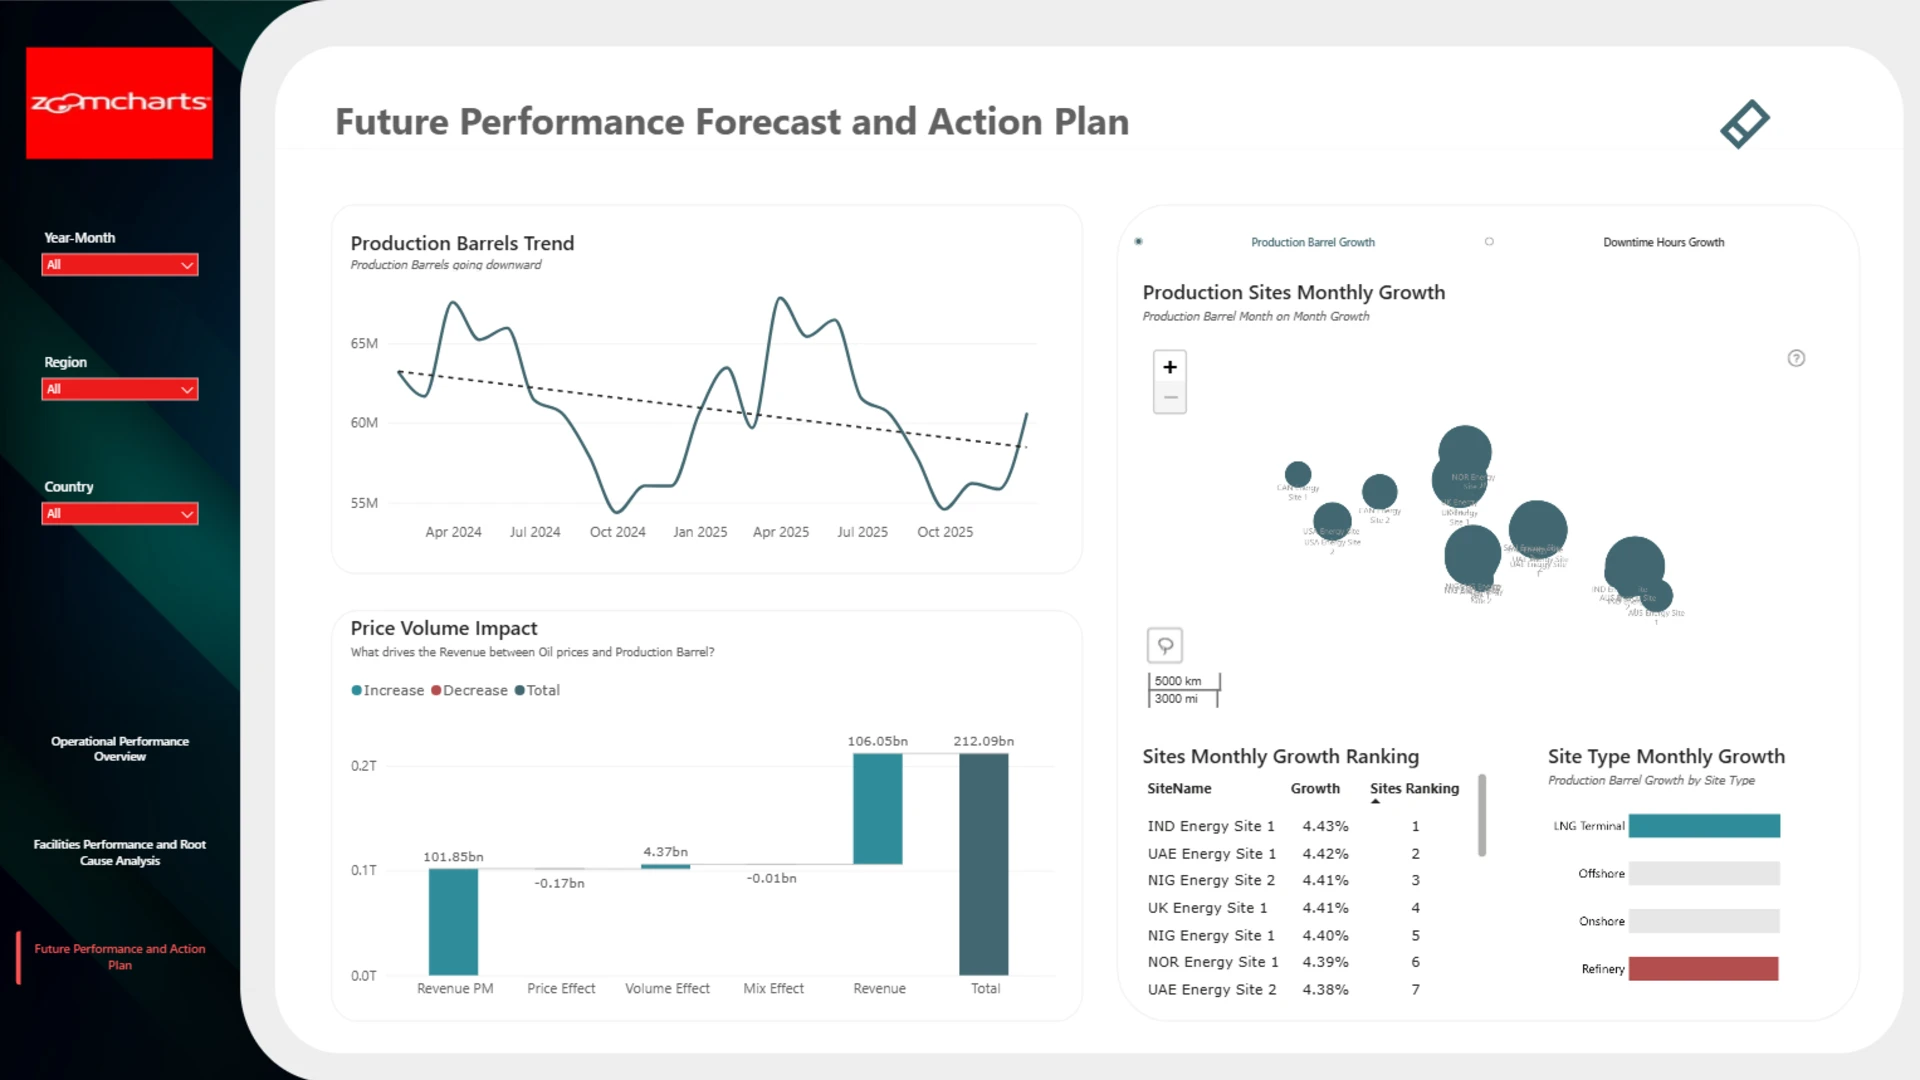
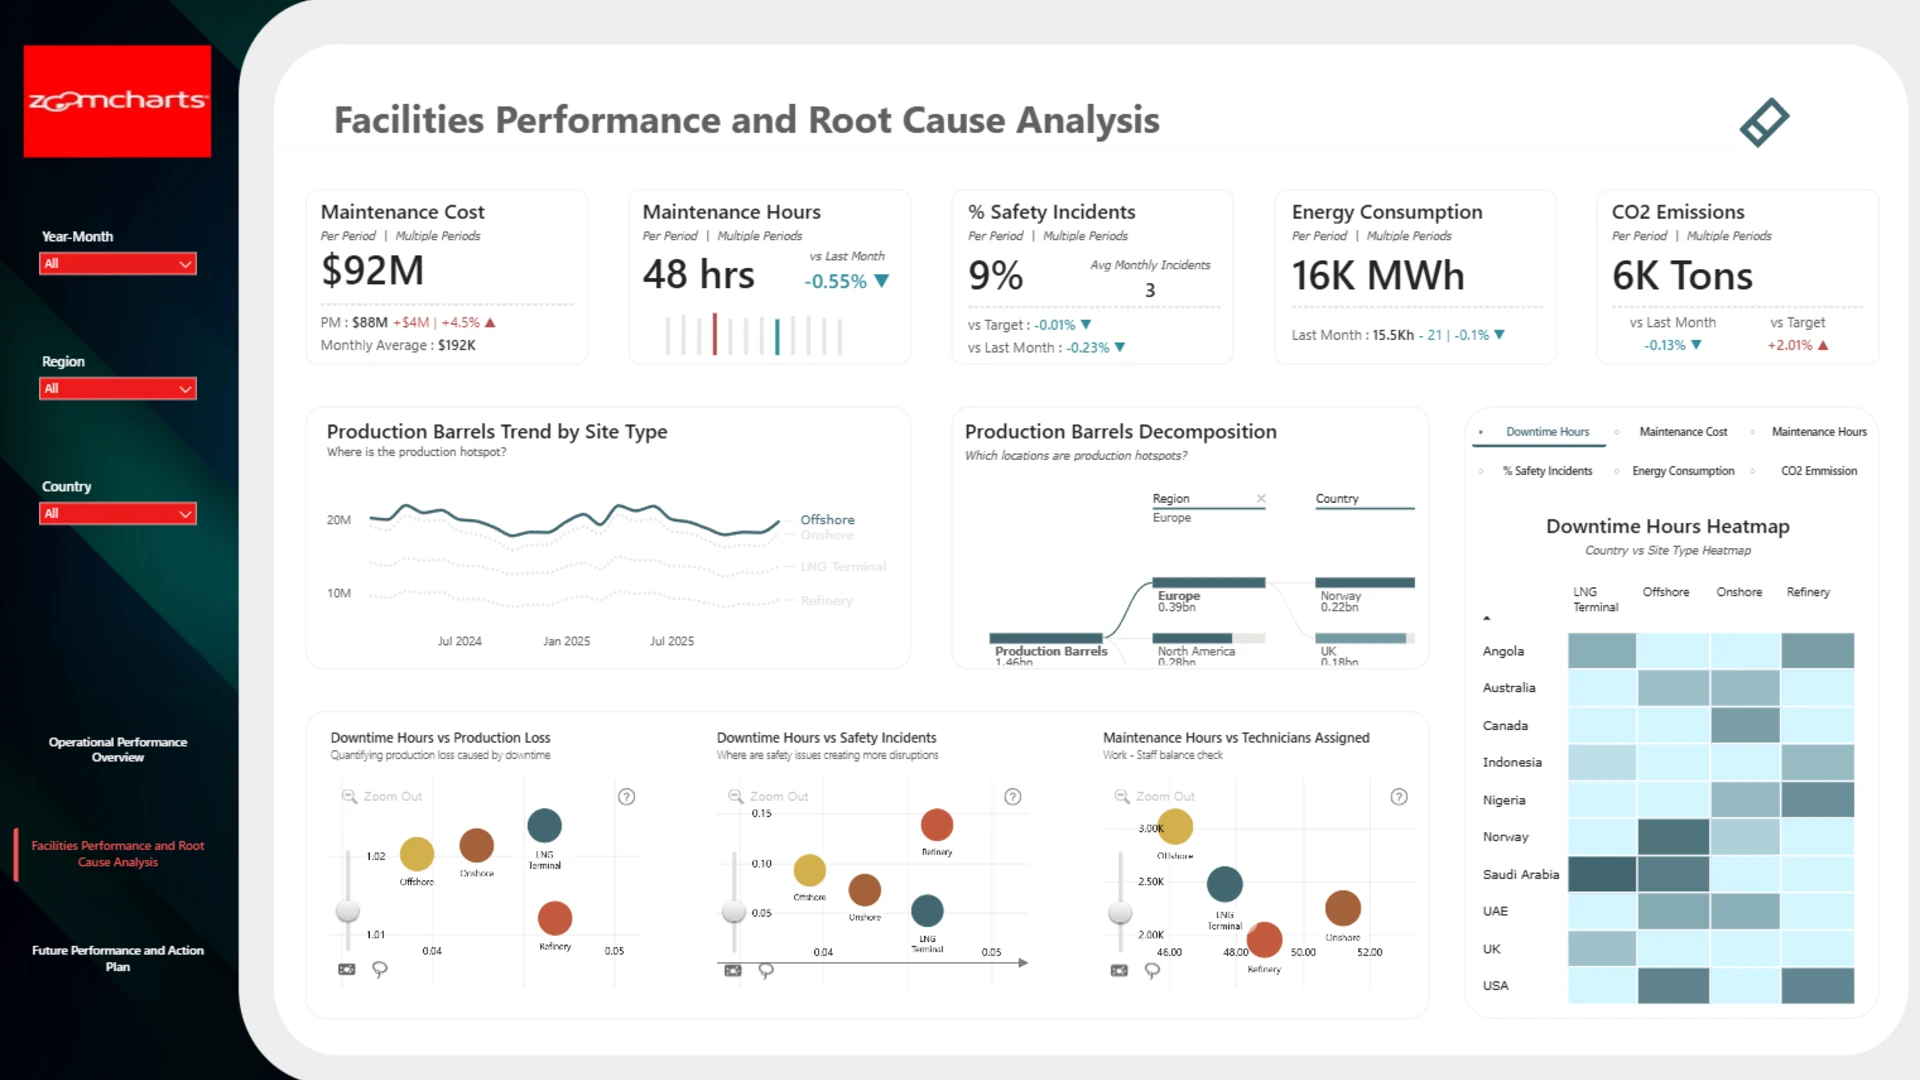
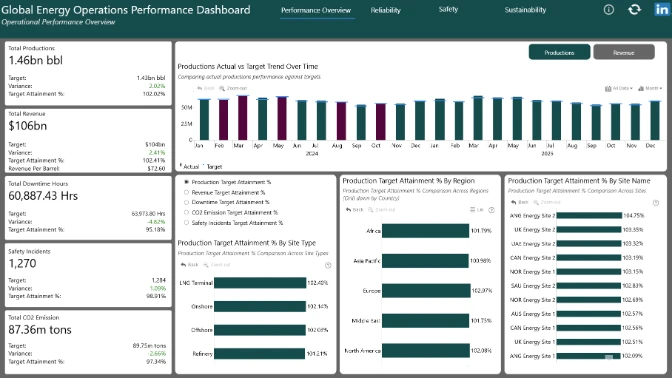
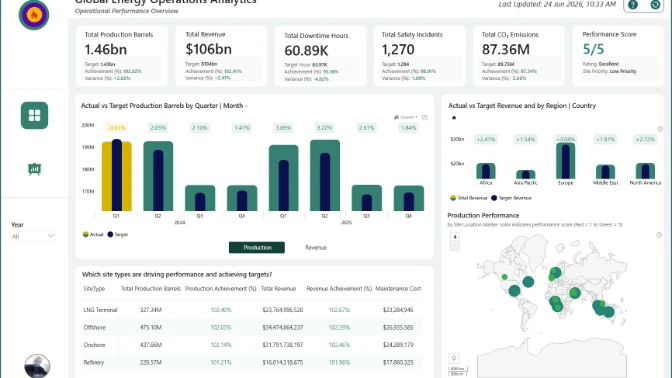
This Power BI Operations Analytics Dashboard helps teams monitor production performance, facility efficiency, downtime, maintenance, safety, energy use, and emissions across regions and sites. The first page highlights a downtime hours heatmap for comparing countries and site types, while the other pages include KPI scorecards, production and revenue trend charts, decomposition analysis, bubble maps, scatter plots, forecast trends, growth rankings, and price-volume impact visuals to support operational decisions and action planning.
This dashbaord built with native Power BI visuals and ZoomCharts Drill Down Visuals, the report helps analyze production, maintenance, downtime, safety, sustainability, operational performance, and financial KPIs to support better business decisions. This report was created for the ZoomCharts 4U Report Challenge June 2026, where Power BI developers showcase their data visualization expertise by solving real-world business use cases.



4U Report Challenges
Participate in data challenges, build and submit reports to get free template downloads.
Join CommunityMobile view allows you to interact with the report. To Download the template please switch to desktop view.
How to use a PBIX template
Preview the interactive report, download the PBIX file, open it in Power BI Desktop, and replace the same data connection with your own dataset.
Preview and download
Explore the report online and download the PBIX template file.
Open in Power BI Desktop
Open the downloaded PBIX file in Power BI Desktop.
Connect your data
Replace the sample data source with your own dataset.
Refresh and adjust
Refresh the model and update fields or visual were needed.
Save and share
Save your report and publish it for your audience.


