731
Power BI Oil & Gas Performance Dashboard 2
Power BI Oil & Gas Performance Dashboard 2
More Report pages
Report Author: Idowu Joshua
731
Share template with others
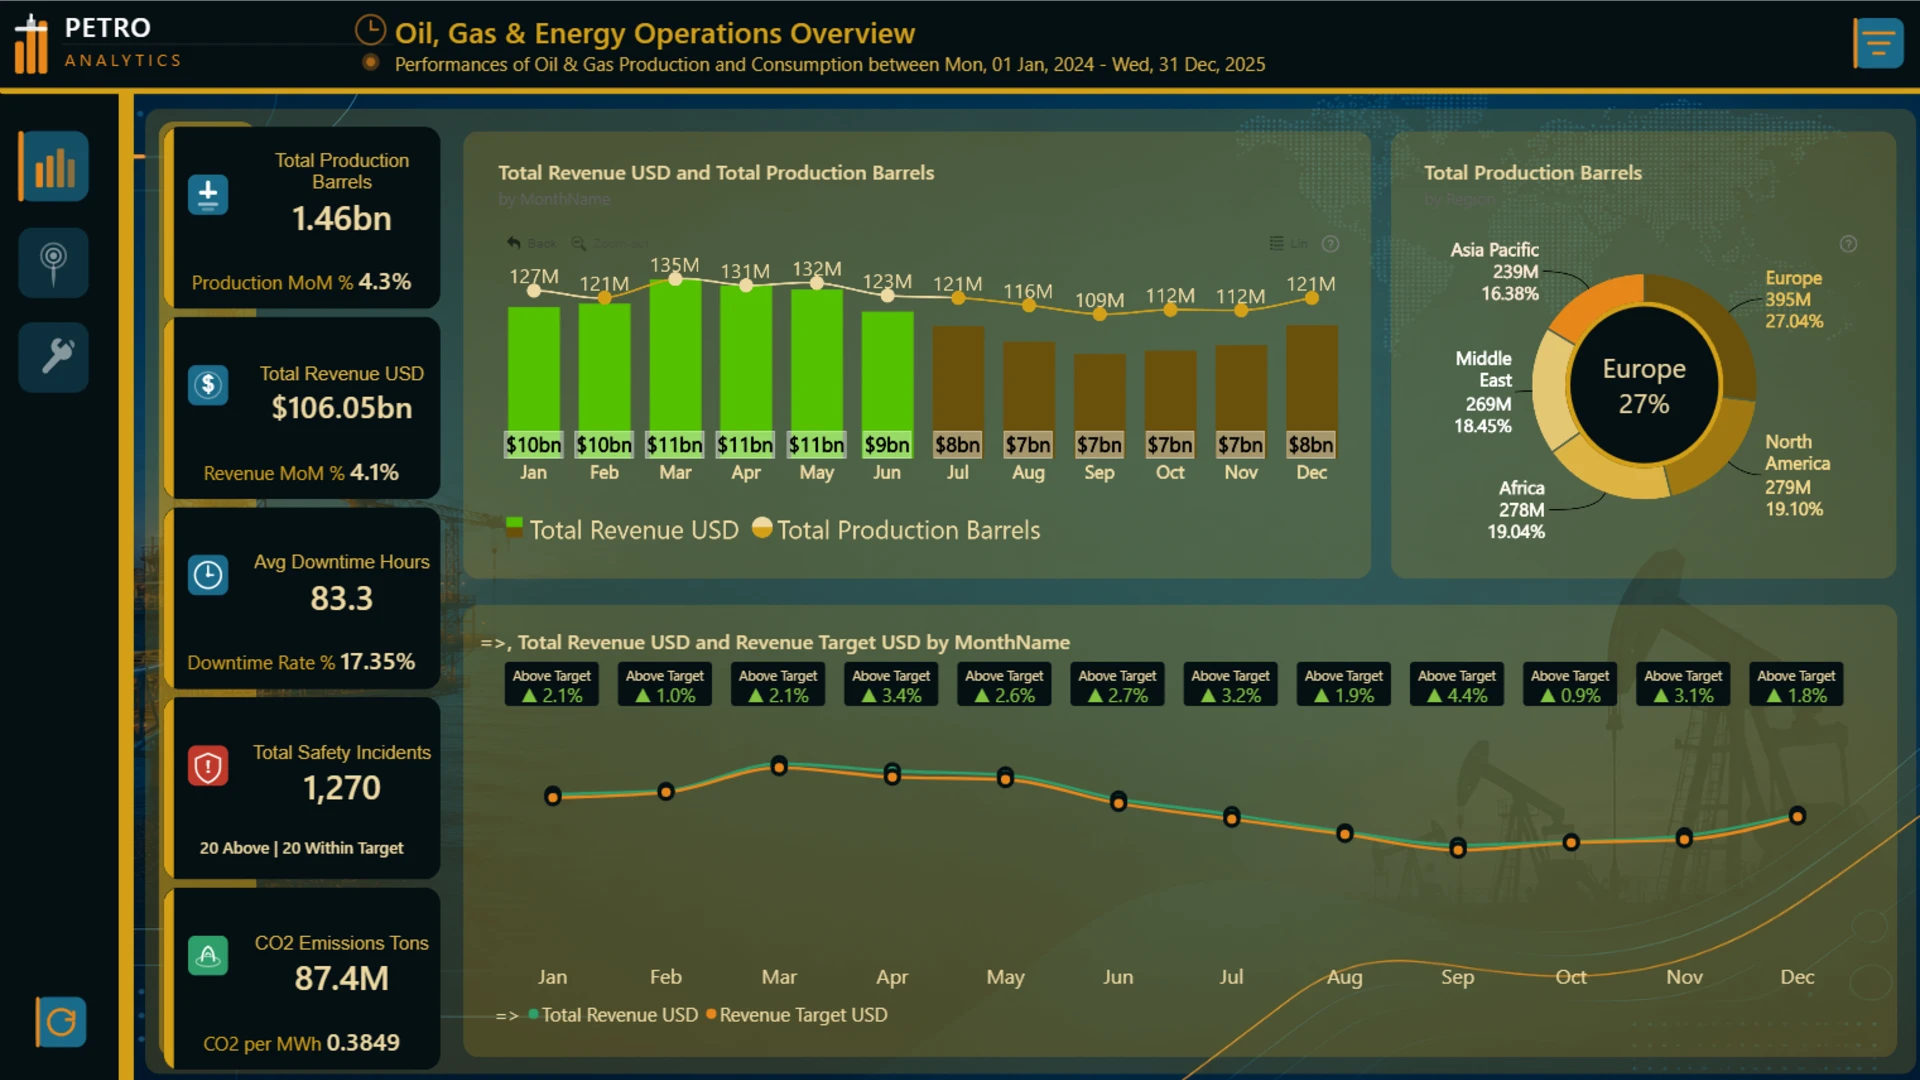
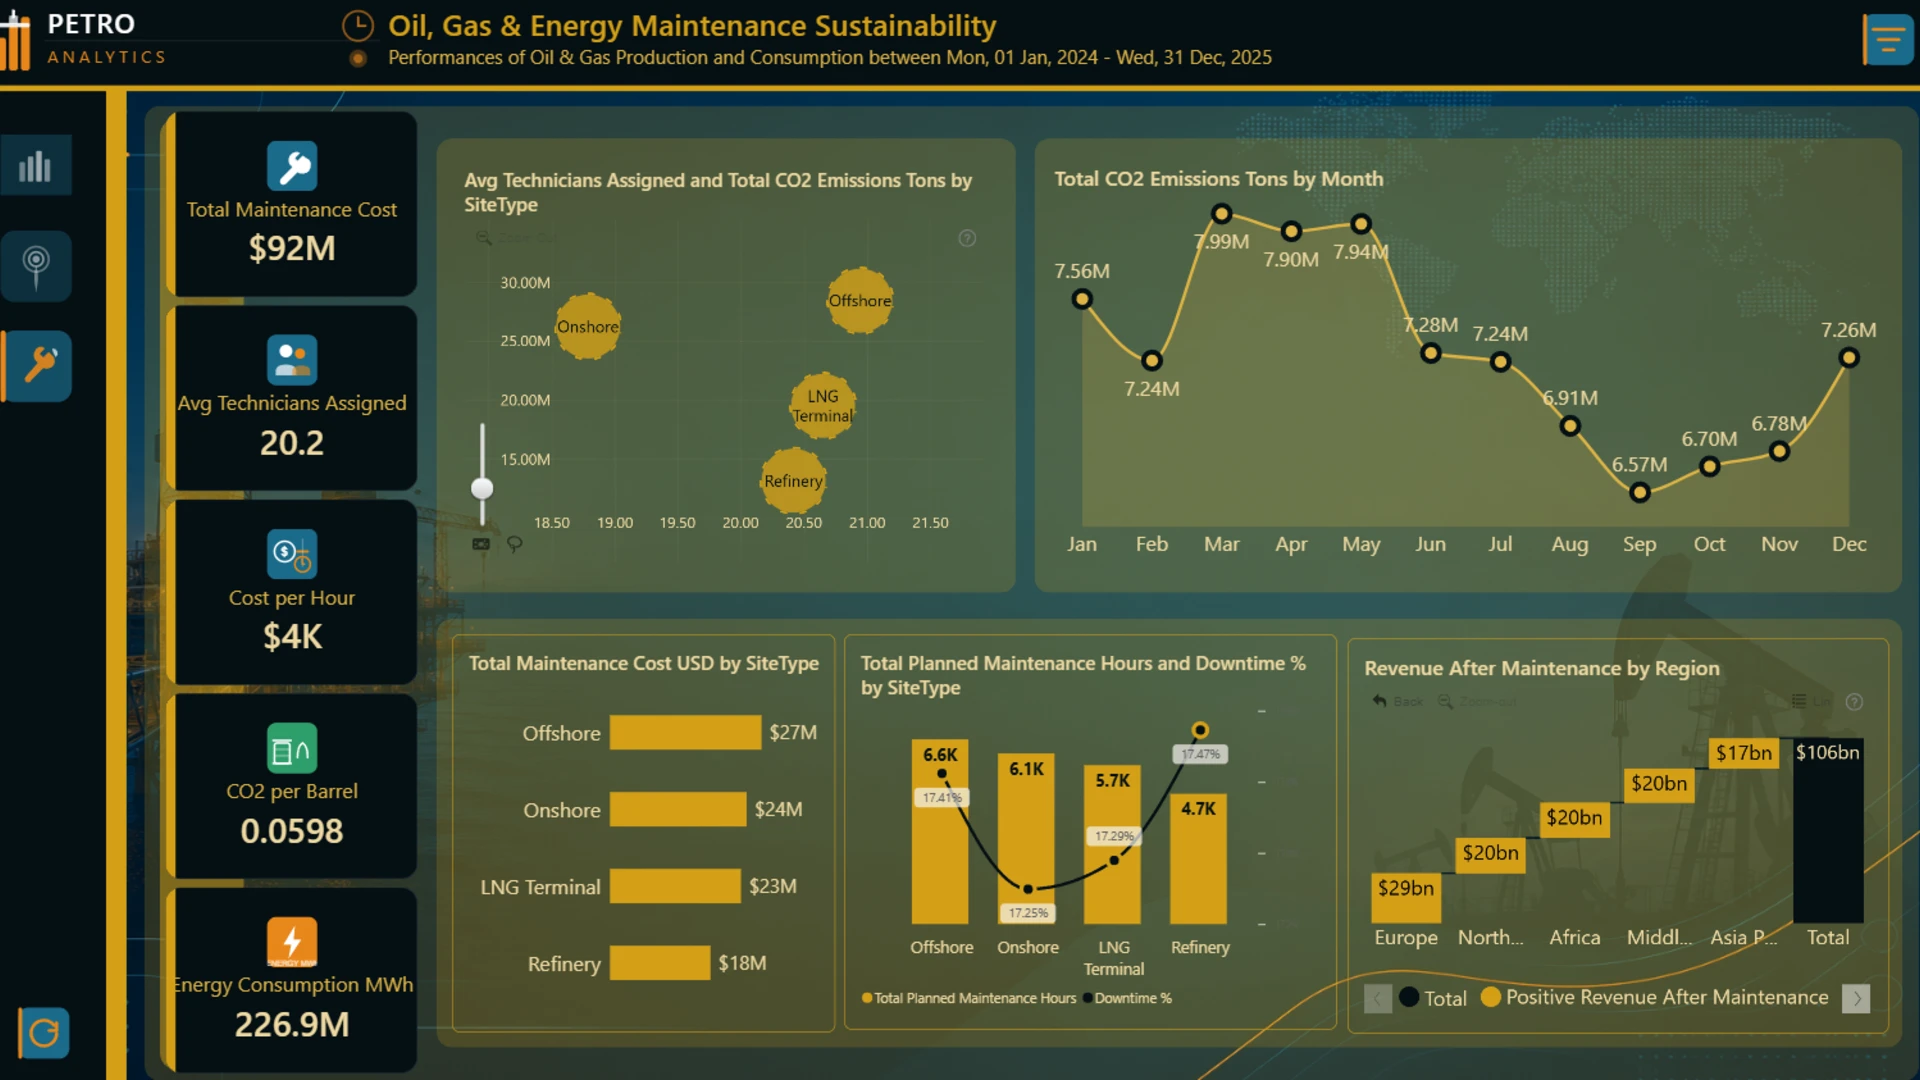
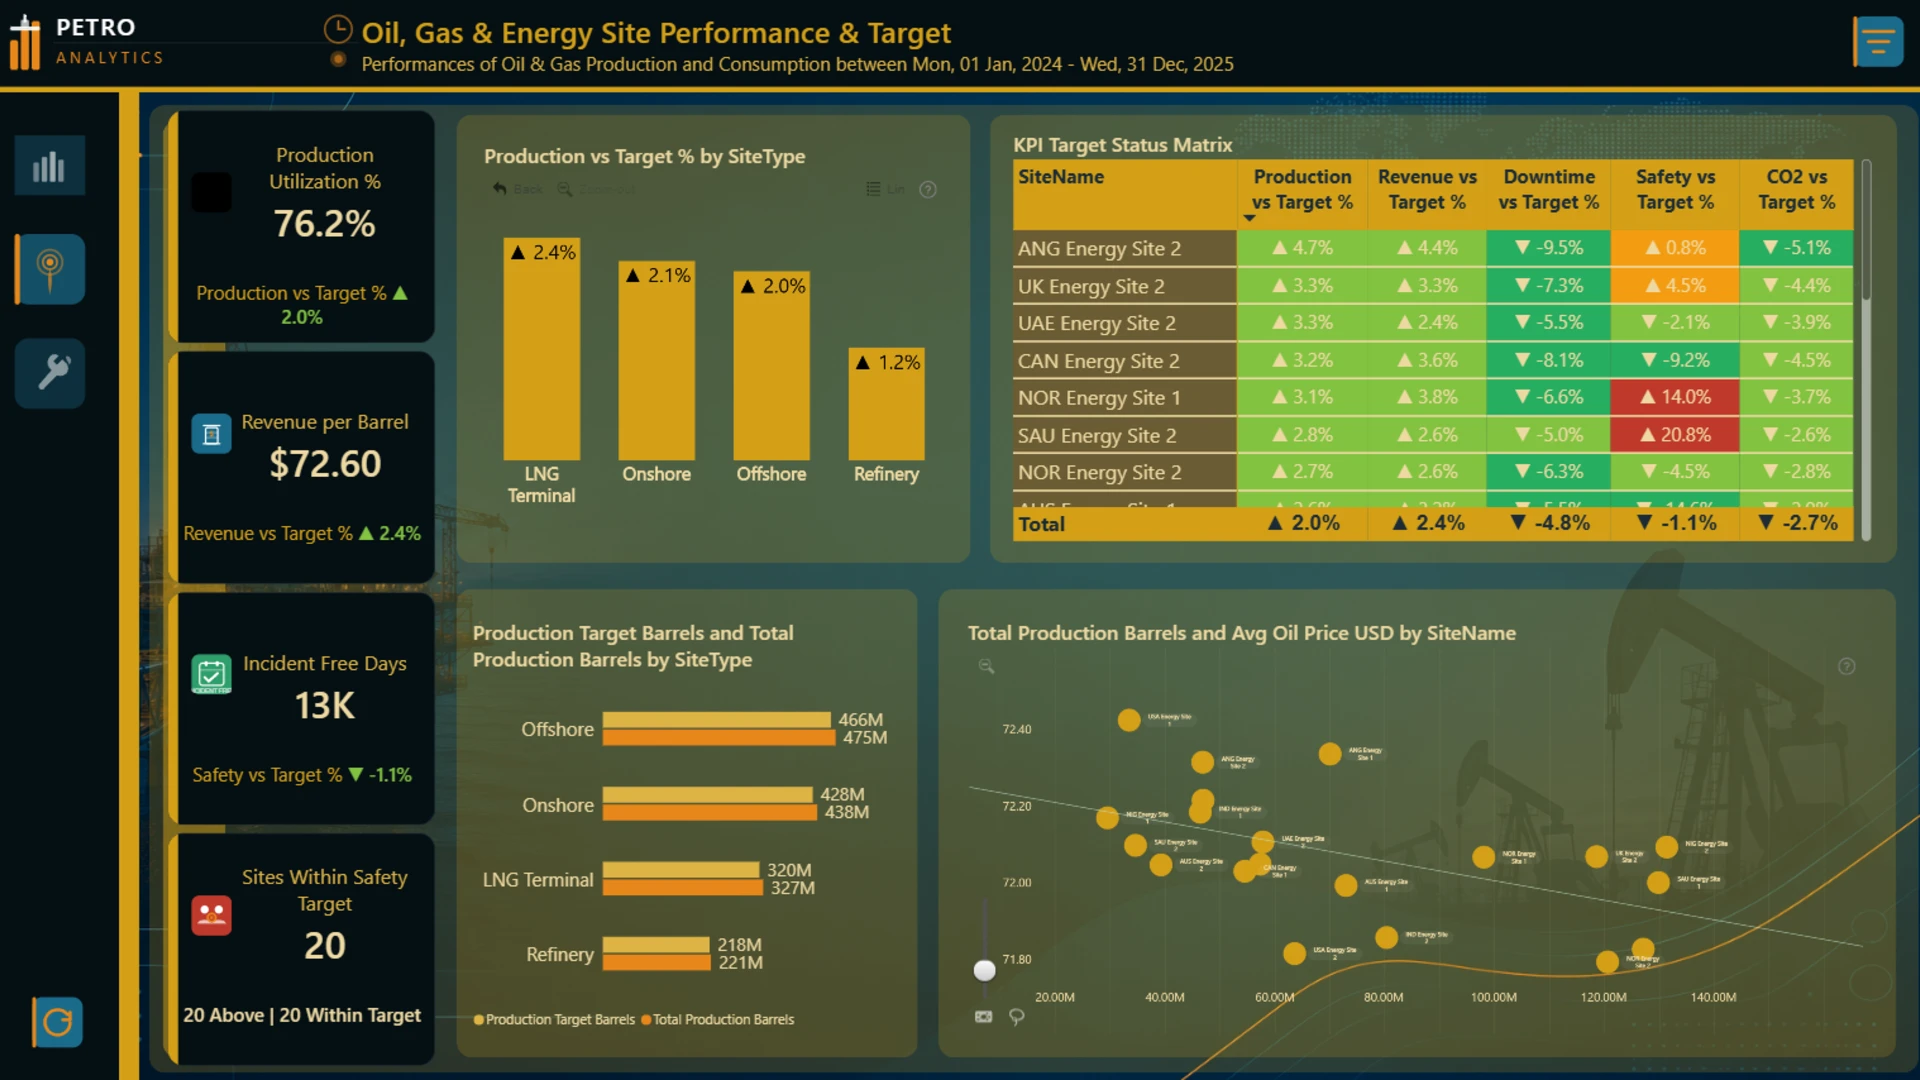
This Power BI Oil & Gas Performance Dashboard provides an executive view of production, revenue, operational efficiency, maintenance, safety, and sustainability across multiple energy sites from January 2024 to December 2025.
The first page features a downtime hours heatmap for quickly identifying operational disruptions by country and site type. Additional pages include KPI cards, trend analysis, decomposition trees, maps, scatter plots, and performance comparisons to explore production, revenue, maintenance, safety, energy consumption, and CO₂ emissions across regions and facilities.
The dashboard enables decision-makers to monitor business performance, asset reliability, and environmental impact in a single interactive report.
Created for the ZoomCharts 4U Report Challenge - June 2026, showcasing advanced Power BI analytics using native visuals and ZoomCharts Drill Down Visuals.
ZoomCharts visuals used




4U Report Challenges
Participate in data challenges, build and submit reports to get free template downloads.
Join CommunityMobile view allows you to interact with the report. To Download the template please switch to desktop view.



How to use a PBIX template
Preview the interactive report, download the PBIX file, open it in Power BI Desktop, and replace the same data connection with your own dataset.
Preview and download
Explore the report online and download the PBIX template file.
Open in Power BI Desktop
Open the downloaded PBIX file in Power BI Desktop.
Connect your data
Replace the sample data source with your own dataset.
Refresh and adjust
Refresh the model and update fields or visual were needed.
Save and share
Save your report and publish it for your audience.


