143
Power BI Offshore Platform Analytics Dashboard
Power BI Offshore Platform Analytics Dashboard
More Report pages
Report Author: Alanijoshua500
143
Share template with others
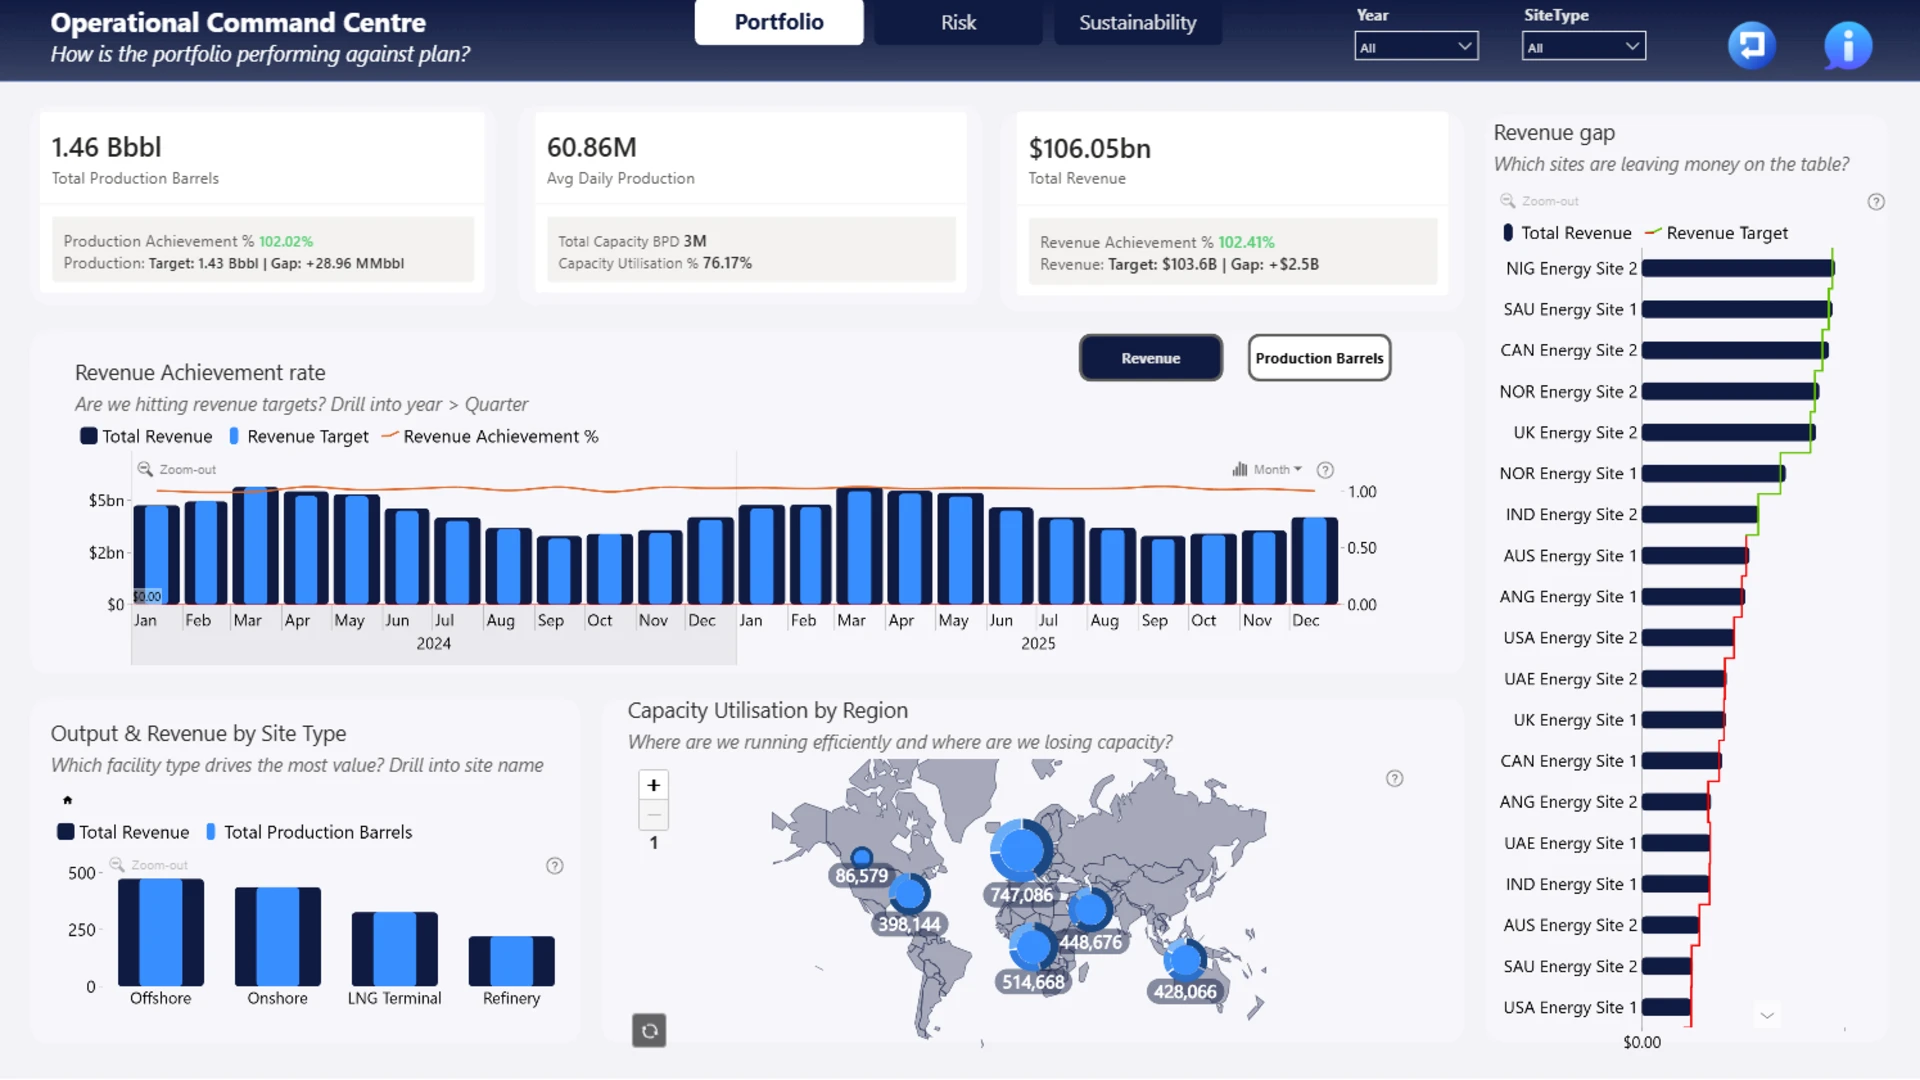
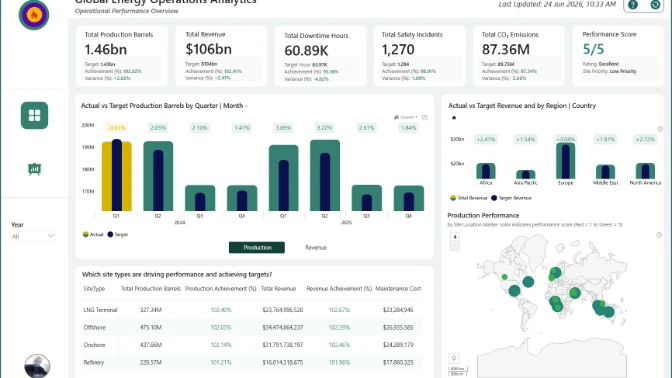
Explore an interactive Power BI dashboard for offshore platform analytics. Built with native Power BI visuals and ZoomCharts Drill Down Visuals, the report helps analyze production, maintenance, downtime, safety, sustainability, operational performance, and financial KPIs to support better business decisions. This report was created for the ZoomCharts 4U Report Challenge June 2026, where Power BI developers showcase their data visualization expertise by solving real-world business use cases using native Power BI visuals together with ZoomCharts Drill Down Visuals.
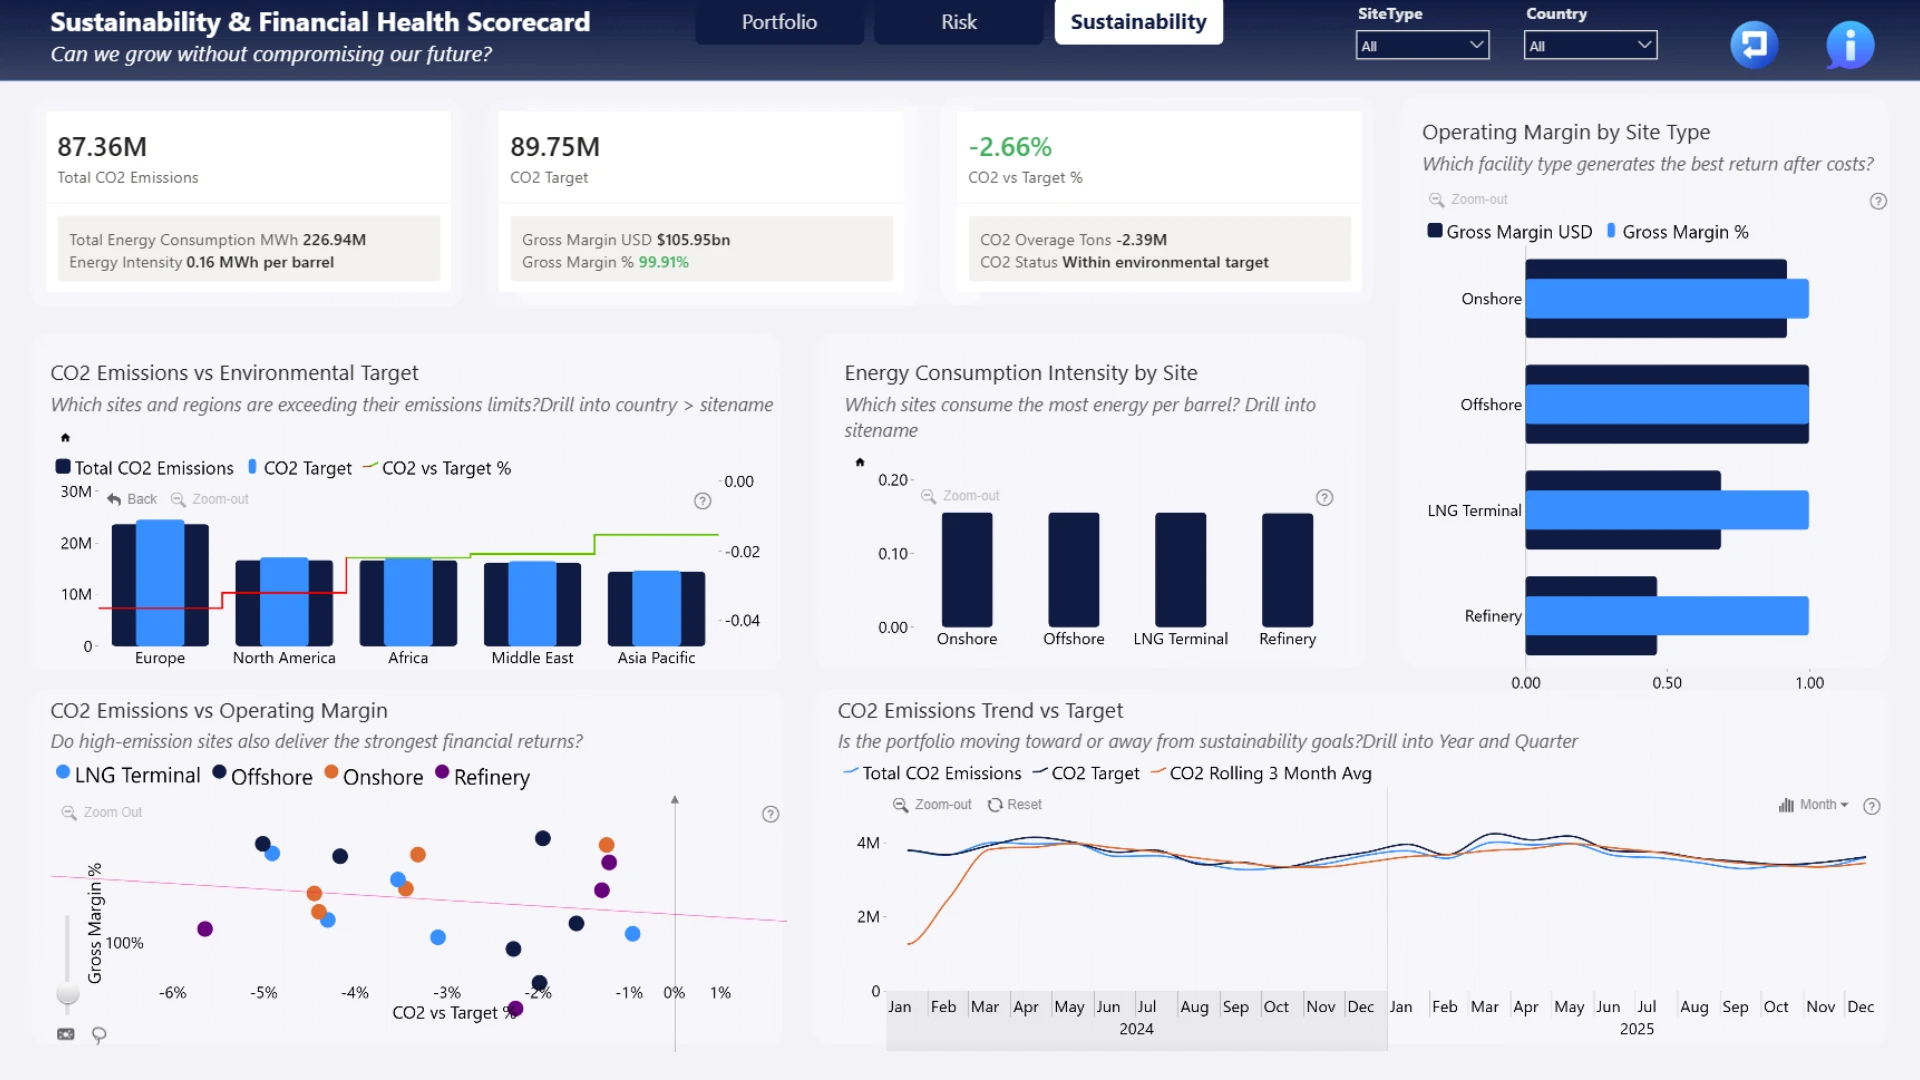
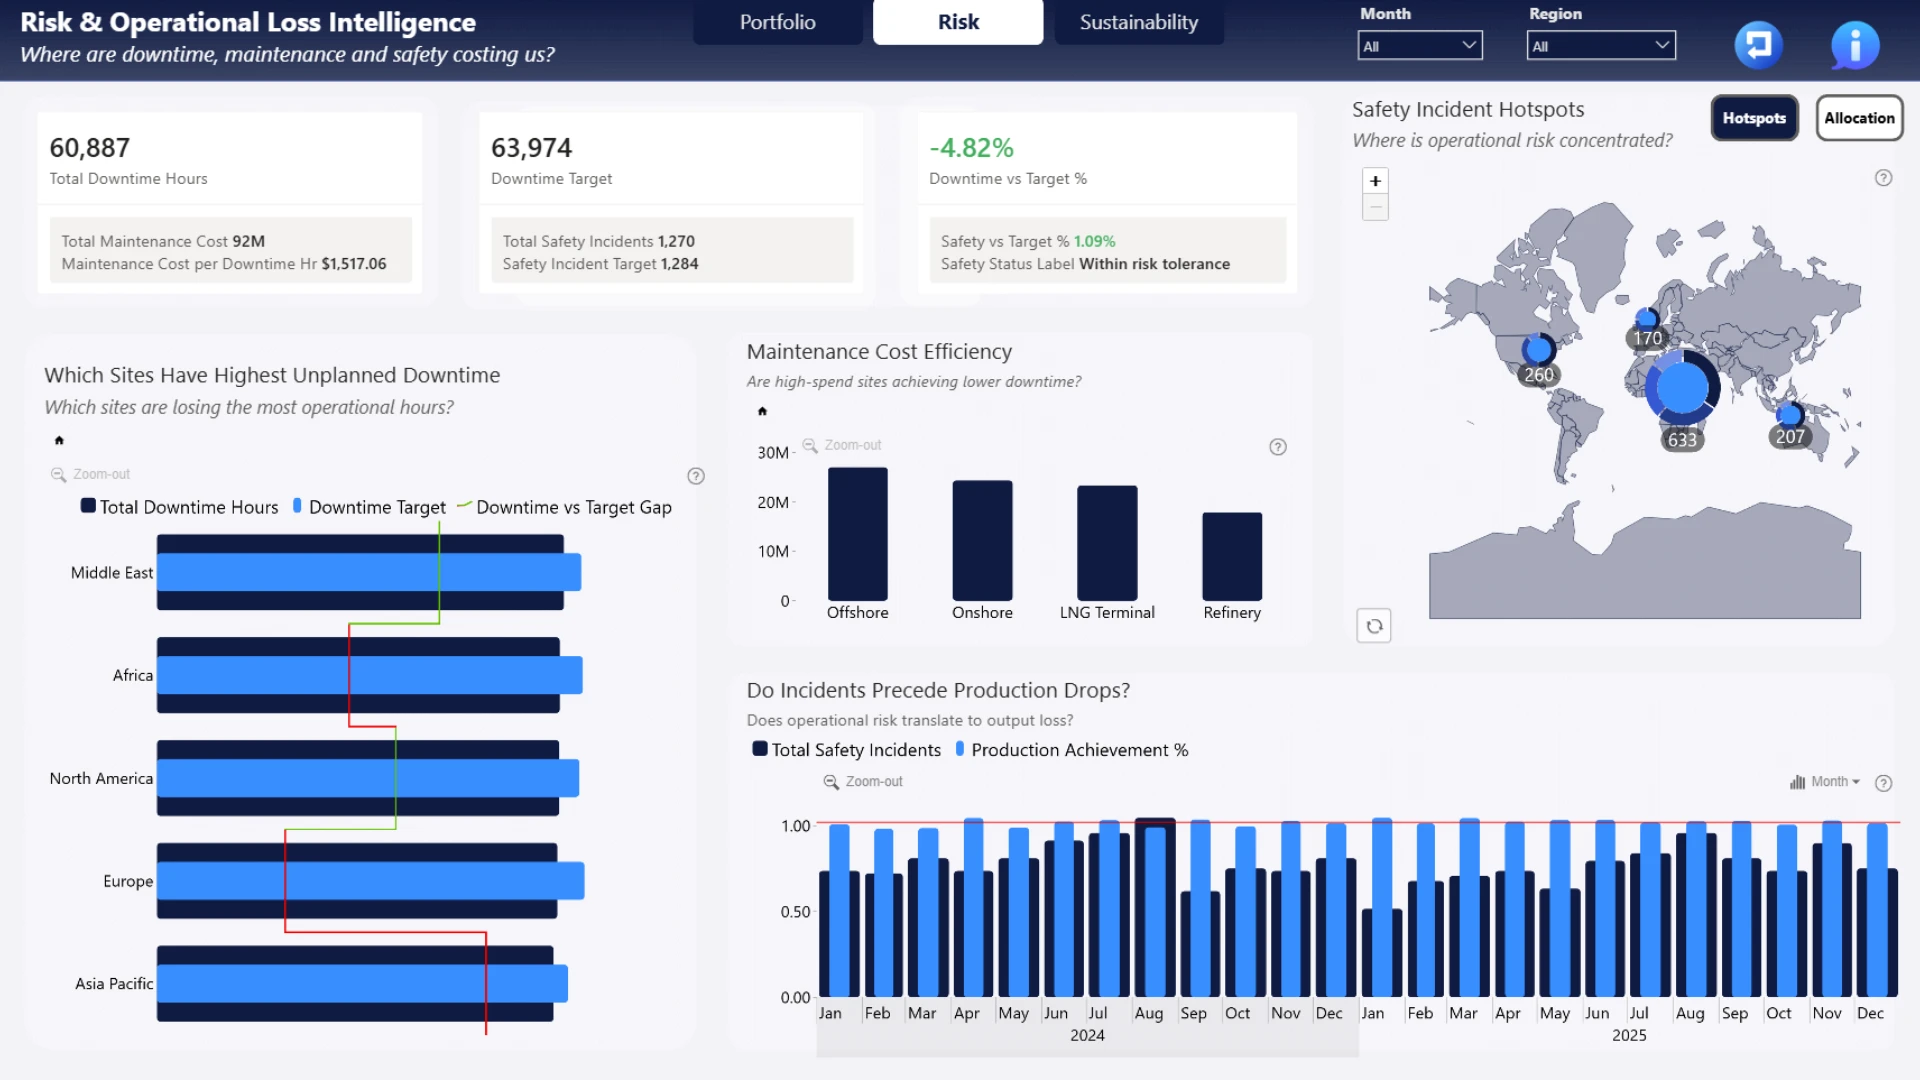
Author's description: This report delivers a three-page executive narrative for Oil, Gas & Energy Operations Analytics. Page 1 (Operational Command Centre) provides a portfolio-level production and revenue overview with regional capacity utilisation. Page 2 (Risk & Operational Loss Intelligence) exposes downtime, maintenance inefficiency, and safety incident hotspots, connecting operational risk directly to revenue loss. Page 3 (Sustainability & Financial Health Scorecard) tracks CO2 emissions, energy intensity per barrel, and operating margin, culminating in a quadrant analysis revealing which sites are profitable and sustainable versus which are trading margin for emissions. Built with ZoomCharts Drill Down visuals for guided hierarchical exploration across all three pages.
ZoomCharts visuals used
4U Report Challenges
Participate in data challenges, build and submit reports to get free template downloads.
Join CommunityMobile view allows you to interact with the report. To Download the template please switch to desktop view.
Was this helpful? Thank you for your feedback!
Sorry about that.
How can we improve it?